




How do you graph the line $y=\dfrac{1}{3}x-2$?
Answer
 Verified
601.2k+ views
Hint: The given equation of the line is in the form of $y=x$. Therefore, by transforming the graph of the line $y=x$ we can graph the given equation $y=\dfrac{1}{3}x-2$. For this, we have to first shift the graph of $y=x$ two units to the right in the horizontal direction to obtain the graph of $y=x-2$. Then we need to expand the graph of $y=x-2$ three units in the horizontal direction to finally obtain the required graph of $y=\dfrac{1}{3}x-2$.
Complete step by step solution:
The equation of the line given in the above question is
$\Rightarrow y=\dfrac{1}{3}x-2$
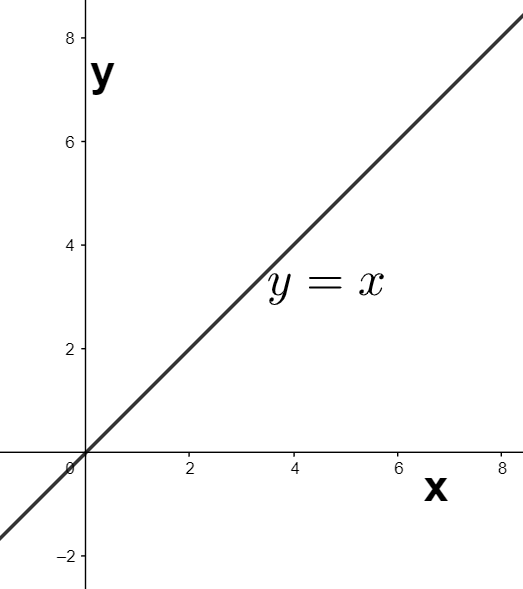
We can observe that the above equation is similar to the equation $y=x$. Therefore we use the graph of the line $y=x$ as a basic graph, which is drawn as shown below.
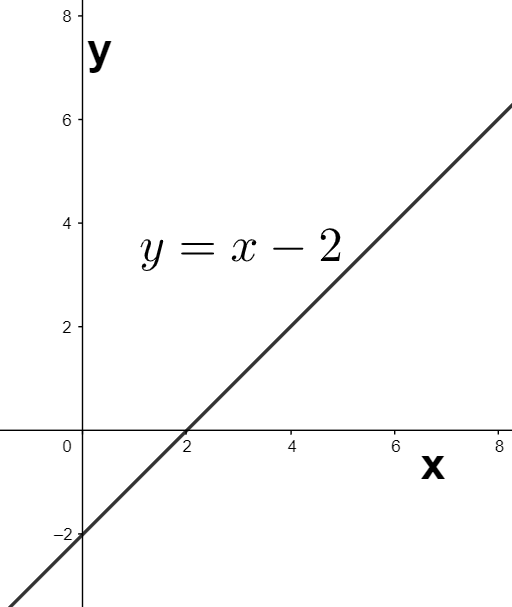
Now, we consider the graph of the equation $y=x-2$. We can see that on changing the independent variable form $x$ to $x-2$, we will obtain the equation from $y=x$ to $y=x-2$. Therefore, the graph of the equation $y=x-2$ can be obtained by shifting the above graph of the equation $y=x$ two units to the right as shown below.
Finally, we change the independent variable from $x$ to $\dfrac{1}{3}x$ so as to obtain the equation of the line as \[y=\dfrac{1}{3}x-2\] from the equation \[y=x-2\]. Since the independent variable is changed from $x$ to $\dfrac{1}{3}x$, the graph of \[y=x-2\] can be expanded three units in the horizontal direction to obtain the required graph of \[y=\dfrac{1}{3}x-2\] as shown below.
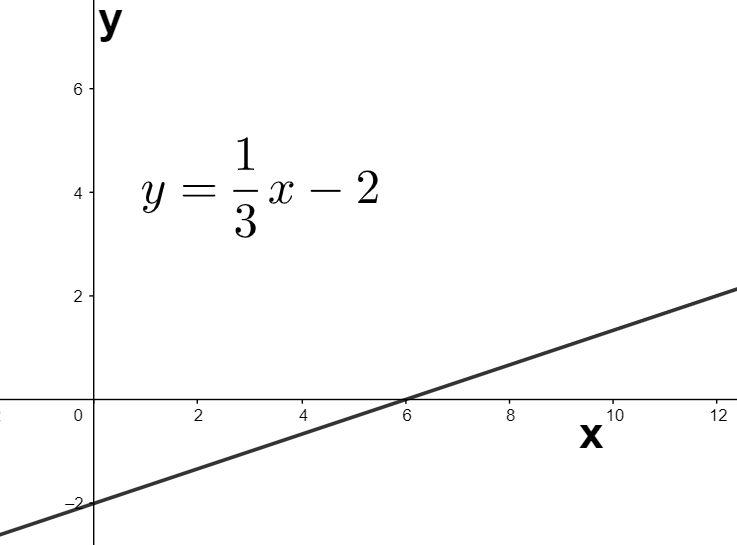
Hence, we have graphed the given equation \[y=\dfrac{1}{3}x-2\].
Note: We can also shift the graph of the equation $y=x$ two units downwards to obtain the graph of $y=x-2$. Also, we must remember that we have to perform the shifting first and then the scaling for solving these types of questions.
Complete step by step solution:
The equation of the line given in the above question is
$\Rightarrow y=\dfrac{1}{3}x-2$
We can observe that the above equation is similar to the equation $y=x$. Therefore we use the graph of the line $y=x$ as a basic graph, which is drawn as shown below.
Now, we consider the graph of the equation $y=x-2$. We can see that on changing the independent variable form $x$ to $x-2$, we will obtain the equation from $y=x$ to $y=x-2$. Therefore, the graph of the equation $y=x-2$ can be obtained by shifting the above graph of the equation $y=x$ two units to the right as shown below.
Finally, we change the independent variable from $x$ to $\dfrac{1}{3}x$ so as to obtain the equation of the line as \[y=\dfrac{1}{3}x-2\] from the equation \[y=x-2\]. Since the independent variable is changed from $x$ to $\dfrac{1}{3}x$, the graph of \[y=x-2\] can be expanded three units in the horizontal direction to obtain the required graph of \[y=\dfrac{1}{3}x-2\] as shown below.
Hence, we have graphed the given equation \[y=\dfrac{1}{3}x-2\].
Note: We can also shift the graph of the equation $y=x$ two units downwards to obtain the graph of $y=x-2$. Also, we must remember that we have to perform the shifting first and then the scaling for solving these types of questions.
Recently Updated Pages
If x a + bt + ct2 where x is in meters and t is in class 11 physics CBSE

A car covers the first half distance between two places class 11 physics CBSE
The resultant of two vectors overrightarrow P and overrightarrow class 11 physics CBSE
Find the value of cos 135 class 11 maths CBSE
A mass M is held in place by an applied force F and class 11 physics CBSE
A solution of glucose in water is labelled as 10 dfracwv class 11 chemistry CBSE
Trending doubts
One Metric ton is equal to kg A 10000 B 1000 C 100 class 11 physics CBSE
Find the value of the expression given below sin 30circ class 11 maths CBSE
What do you mean by retardation What is its SI uni class 11 physics CBSE
Draw a diagram of nephron and explain its structur class 11 biology CBSE
10 examples of friction in our daily life
Difference between physical and chemical change class 11 chemistry CBSE