


How do you graph the line \[y = - x + 8\]?
Answer
571.8k+ views
Hint: A graph of a function f is the set of ordered pairs; the equation of graph is generally represented as \[y = f(x)\], where x and f(x) are real numbers. We substitute the value of x and we determine the value of y and then we mark the points in the graph and we join the points.
Complete step-by-step answer:
Here in this question, we have to plot the graph for the given function. A graph of a function is set of ordered pairs and it is represented as \[y = f(x)\], where x and f(x) are real numbers. These pairs are in the form of cartesian form and the graph is the two-dimensional graph.
First, we have to find the value of y by using the graph equation \[y = - x + 8\]. Let we substitute the value of x has -3, -2, -1, 0, 1, 2, and 3.
Now we consider the value of x as -3, the value of y is
\[
\Rightarrow y = - ( - 3) + 8 \\
\Rightarrow y = 3 + 8 \\
\Rightarrow y = 11 \\
\]
Now we consider the value of x as -2, the value of y is
\[
\Rightarrow y = - ( - 2) + 8 \\
\Rightarrow y = 2 + 8 \\
\Rightarrow y = 10 \\
\]
Now we consider the value of x as -1, the value of y is
\[
\Rightarrow y = - ( - 1) + 8 \\
\Rightarrow y = 1 + 8 \\
\Rightarrow y = 9 \\
\]
Now we consider the value of x as 0, the value of y is
\[
\Rightarrow y = (0) + 8 \\
\Rightarrow y = 8 \\
\]
Now we consider the value of x as 1, the value of y is
\[
\Rightarrow y = - 1 + 8 \\
\Rightarrow y = 7 \\
\]
Now we consider the value of x as 2, the value of y is
\[
\Rightarrow y = - 2 + 8 \\
\Rightarrow y = 6 \\
\]
Now we consider the value of x as 3, the value of y is
\[
\Rightarrow y = - 3 + 8 \\
\Rightarrow y = 5 \\
\]
Now we draw a table for these values we have
The graph plotted for this point is represented below:
Note: The graph is plotted x-axis versus y axis. The graph is two dimensional. By the equation of a graph, we can plot the graph by assuming the value of x. we can’t assume the value of y. because the value of y depends on the value of x. Hence, we have plotted the graph.
Complete step-by-step answer:
Here in this question, we have to plot the graph for the given function. A graph of a function is set of ordered pairs and it is represented as \[y = f(x)\], where x and f(x) are real numbers. These pairs are in the form of cartesian form and the graph is the two-dimensional graph.
First, we have to find the value of y by using the graph equation \[y = - x + 8\]. Let we substitute the value of x has -3, -2, -1, 0, 1, 2, and 3.
Now we consider the value of x as -3, the value of y is
\[
\Rightarrow y = - ( - 3) + 8 \\
\Rightarrow y = 3 + 8 \\
\Rightarrow y = 11 \\
\]
Now we consider the value of x as -2, the value of y is
\[
\Rightarrow y = - ( - 2) + 8 \\
\Rightarrow y = 2 + 8 \\
\Rightarrow y = 10 \\
\]
Now we consider the value of x as -1, the value of y is
\[
\Rightarrow y = - ( - 1) + 8 \\
\Rightarrow y = 1 + 8 \\
\Rightarrow y = 9 \\
\]
Now we consider the value of x as 0, the value of y is
\[
\Rightarrow y = (0) + 8 \\
\Rightarrow y = 8 \\
\]
Now we consider the value of x as 1, the value of y is
\[
\Rightarrow y = - 1 + 8 \\
\Rightarrow y = 7 \\
\]
Now we consider the value of x as 2, the value of y is
\[
\Rightarrow y = - 2 + 8 \\
\Rightarrow y = 6 \\
\]
Now we consider the value of x as 3, the value of y is
\[
\Rightarrow y = - 3 + 8 \\
\Rightarrow y = 5 \\
\]
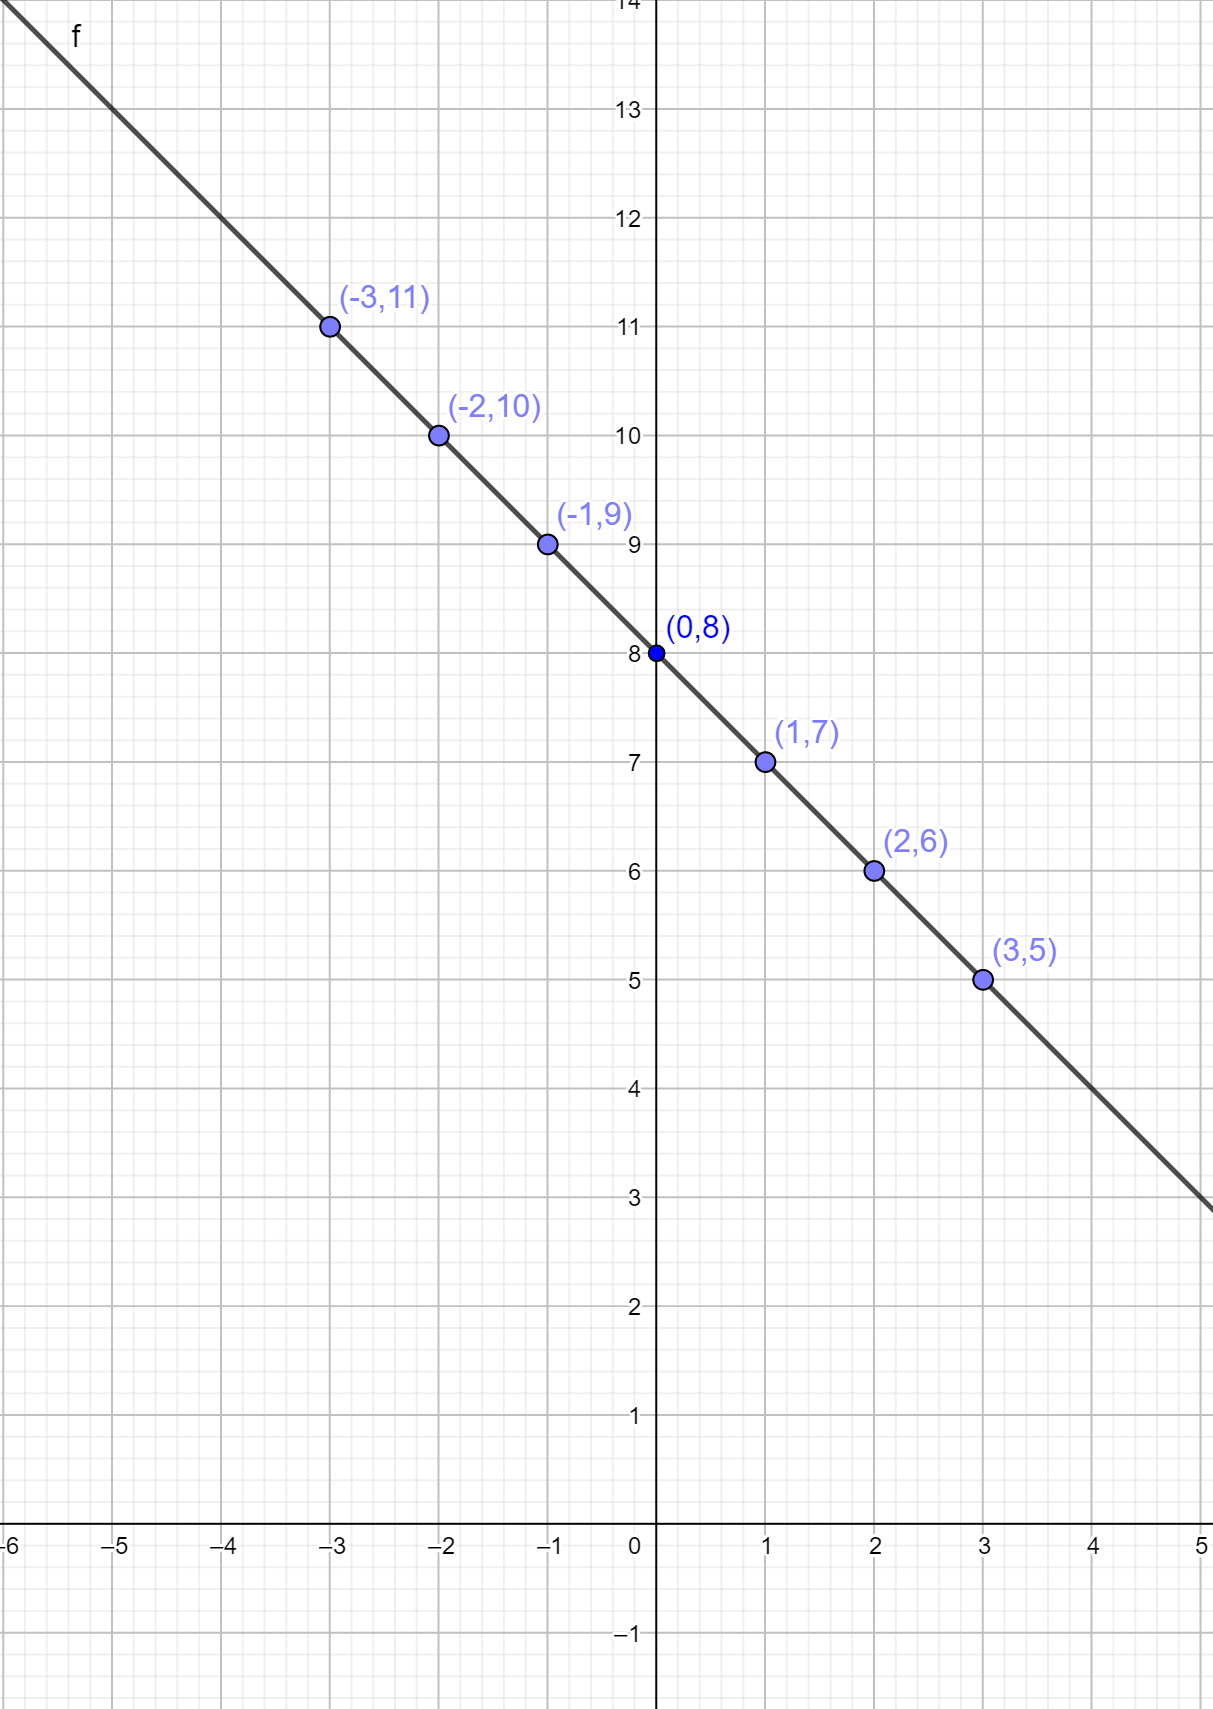
Now we draw a table for these values we have
| X | -3 | -2 | -1 | 0 | 1 | 2 | 3 |
| y | 11 | 10 | 9 | 8 | 7 | 6 | 5 |
The graph plotted for this point is represented below:
Note: The graph is plotted x-axis versus y axis. The graph is two dimensional. By the equation of a graph, we can plot the graph by assuming the value of x. we can’t assume the value of y. because the value of y depends on the value of x. Hence, we have plotted the graph.
Recently Updated Pages
Master Class 11 Social Science: Engaging Questions & Answers for Success
Master Class 11 English: Engaging Questions & Answers for Success
Master Class 11 Maths: Engaging Questions & Answers for Success
Master Class 11 Chemistry: Engaging Questions & Answers for Success
Master Class 11 Biology: Engaging Questions & Answers for Success
Master Class 11 Physics: Engaging Questions & Answers for Success
Trending doubts
One Metric ton is equal to kg A 10000 B 1000 C 100 class 11 physics CBSE
Difference Between Prokaryotic Cells and Eukaryotic Cells
Draw a diagram of a plant cell and label at least eight class 11 biology CBSE
Two of the body parts which do not appear in MRI are class 11 biology CBSE
Which gas is abundant in air class 11 chemistry CBSE
10 examples of friction in our daily life