


How do you graph the line \[y = - 3x + 3\]?
Answer
590.4k+ views
Hint: Here, we are given a linear equation in two variables. We will substitute different values of \[x\] in the given equation to find corresponding values of \[y\]. This will give us the coordinate points and using these points we will draw the graph of the given equation.
Complete Step by Step Solution:
We are given an equation of a line-
\[y = - 3x + 3\]……………………………………………………………………………………………..\[\left( 1 \right)\]
Now, we will find the coordinates for the given equation of a line.
Now, by substituting \[x = 0\] in equation\[\left( 1 \right)\] , we get
\[y = - 3\left( 0 \right) + 3\]
\[ \Rightarrow y = 3\]
Substituting \[x = 1\] in equation \[\left( 1 \right)\] , we get
\[y = - 3\left( 1 \right) + 3\]
\[ \Rightarrow y = 0\]
The co-ordinates \[\left( {0,3} \right)\] and \[\left( {1,0} \right)\] are the \[x\]-intercept and \[y\] -intercept respectively.
Now, by substituting \[x = 2\] in equation \[\left( 1 \right)\] , we get
\[y = - 3\left( 2 \right) + 3\]
\[ \Rightarrow y = - 3\]
Substituting \[x = 3\] in equation \[\left( 1 \right)\], we get
\[y = - 3\left( 3 \right) + 3\]
\[ \Rightarrow y = - 6\]
Now, by substituting \[x = 4\] in equation \[\left( 1 \right)\], we get
\[y = - 3\left( 4 \right) + 3\]
\[ \Rightarrow y = - 9\]
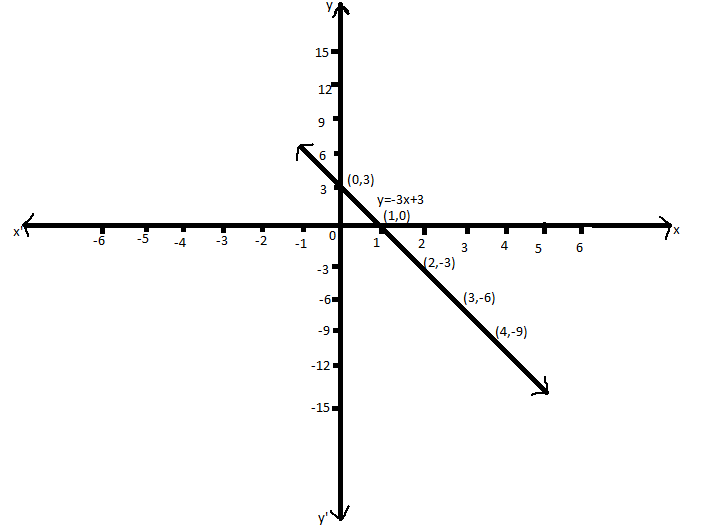
So, the coordinates of the equation of line are \[\left( {0,3} \right)\],\[\left( {1,0} \right)\] ,\[\left( {2, - 3} \right)\] ,\[\left( {3, - 6} \right)\] and \[\left( {4, - 9} \right)\]
Therefore, the coordinates of the equation of line are \[\left( {0,3} \right)\],\[\left( {1,0} \right)\] ,\[\left( {2, - 3} \right)\] ,\[\left( {3, - 6} \right)\] and \[\left( {4, - 9} \right)\].
Now, we plot the graph for the co-ordinates, we get
Note:
We will solve the linear equation in two variables by the method of substitution to find the solution set at different points. Thus the solution set becomes the coordinates of the point in the graph for the linear equation. Linear equation in two variables is an equation with the highest power of 1 in two variables. Thus the graph of a linear equation is always a straight line. The given equation of the line is in the slope-intercept form\[y = mx + c\] where \[m\] is the slope and \[c\] is the \[y\]-intercept. A point crossing the x-axis is called x-intercept and A point crossing the y-axis is called the y-intercept.
Complete Step by Step Solution:
We are given an equation of a line-
\[y = - 3x + 3\]……………………………………………………………………………………………..\[\left( 1 \right)\]
Now, we will find the coordinates for the given equation of a line.
Now, by substituting \[x = 0\] in equation\[\left( 1 \right)\] , we get
\[y = - 3\left( 0 \right) + 3\]
\[ \Rightarrow y = 3\]
Substituting \[x = 1\] in equation \[\left( 1 \right)\] , we get
\[y = - 3\left( 1 \right) + 3\]
\[ \Rightarrow y = 0\]
The co-ordinates \[\left( {0,3} \right)\] and \[\left( {1,0} \right)\] are the \[x\]-intercept and \[y\] -intercept respectively.
Now, by substituting \[x = 2\] in equation \[\left( 1 \right)\] , we get
\[y = - 3\left( 2 \right) + 3\]
\[ \Rightarrow y = - 3\]
Substituting \[x = 3\] in equation \[\left( 1 \right)\], we get
\[y = - 3\left( 3 \right) + 3\]
\[ \Rightarrow y = - 6\]
Now, by substituting \[x = 4\] in equation \[\left( 1 \right)\], we get
\[y = - 3\left( 4 \right) + 3\]
\[ \Rightarrow y = - 9\]
So, the coordinates of the equation of line are \[\left( {0,3} \right)\],\[\left( {1,0} \right)\] ,\[\left( {2, - 3} \right)\] ,\[\left( {3, - 6} \right)\] and \[\left( {4, - 9} \right)\]
Therefore, the coordinates of the equation of line are \[\left( {0,3} \right)\],\[\left( {1,0} \right)\] ,\[\left( {2, - 3} \right)\] ,\[\left( {3, - 6} \right)\] and \[\left( {4, - 9} \right)\].
Now, we plot the graph for the co-ordinates, we get
Note:
We will solve the linear equation in two variables by the method of substitution to find the solution set at different points. Thus the solution set becomes the coordinates of the point in the graph for the linear equation. Linear equation in two variables is an equation with the highest power of 1 in two variables. Thus the graph of a linear equation is always a straight line. The given equation of the line is in the slope-intercept form\[y = mx + c\] where \[m\] is the slope and \[c\] is the \[y\]-intercept. A point crossing the x-axis is called x-intercept and A point crossing the y-axis is called the y-intercept.
Recently Updated Pages
Master Class 12 Economics: Engaging Questions & Answers for Success
Master Class 12 English: Engaging Questions & Answers for Success
Master Class 12 Social Science: Engaging Questions & Answers for Success
Master Class 12 Maths: Engaging Questions & Answers for Success
Master Class 12 Physics: Engaging Questions & Answers for Success
Master Class 11 Social Science: Engaging Questions & Answers for Success
Trending doubts
One Metric ton is equal to kg A 10000 B 1000 C 100 class 11 physics CBSE
Difference Between Prokaryotic Cells and Eukaryotic Cells
Find the value of the expression given below sin 30circ class 11 maths CBSE
Two of the body parts which do not appear in MRI are class 11 biology CBSE
Draw a diagram of nephron and explain its structur class 11 biology CBSE
10 examples of friction in our daily life