


How do you graph the line $ y = 3x + 1 $ ?
Answer
595.8k+ views
Hint: In graphs the equation of the form $ ax + by + c = 0 $ will be a straight line, calculate y for different values of x and plot it on the graph.
Complete step-by-step answer:
We are given an equation that is a linear equation in two variables , here we are having variables $ x $ and $ y $ telling $ y = 3x + 1 $ .
So what we are going to do in this question, we are jumping on the cartesian plane.
There is one most important property of the plane which we have to remember while plotting our equation that graphs to any linear equation in two variables of the form $ ax + by + c = 0 $ will be straight line.
So, in order to draw a line, we must have at least two points on the graph which we can connect to form a line.
We’ll be taking one point as y-intercept and another when $ x = - 1 $ to form the line.
To find y-intercept make $ x = 0 $ in the equation
$
y = 3x + 1 \\
y = 3(0) + 1 \\
y = 1 \;
$
Now taking $ x = - 1 $
$
y = 3x + 1 \\
y = 3( - 1) + 1 \\
y = - 3 + 1 \\
y = - 2 \;
$
Forming the table of ordered pairs of points.
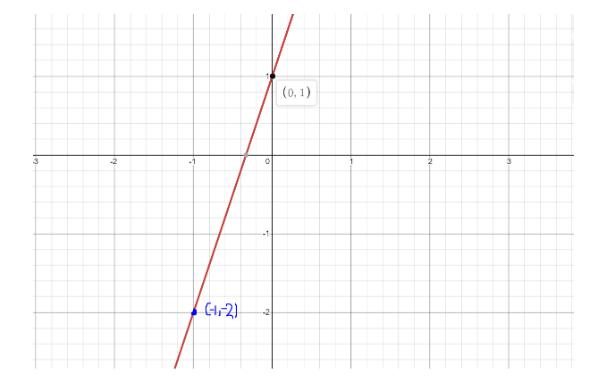
Now plotting points $ \left( {0,1} \right) $ and $ \left( { - 1, - 2} \right) $ and connecting them to form the line of the equation $ y = 3x + 1 $ .
Hence we’ve successfully plotted our graph of $ y = 3x + 1 $
Note: 1. Cartesian Plane: A Cartesian Plane is given its name by the French mathematician Rene Descartes ,who first used this plane in the field of mathematics .It is defined as the two mutually perpendicular number line , the one which is horizontal is given name x-axis and the one which is vertical is known as y-axis. With the help of these axes we can plot any point on this cartesian plane with the help of an ordered pair of numbers.
2.Draw the cartesian plane only with the help of a straight ruler and pencil to get the perfect and accurate results.
3.You can take any two points from the equation to plot the graph to the equation.
Complete step-by-step answer:
We are given an equation that is a linear equation in two variables , here we are having variables $ x $ and $ y $ telling $ y = 3x + 1 $ .
So what we are going to do in this question, we are jumping on the cartesian plane.
There is one most important property of the plane which we have to remember while plotting our equation that graphs to any linear equation in two variables of the form $ ax + by + c = 0 $ will be straight line.
So, in order to draw a line, we must have at least two points on the graph which we can connect to form a line.
We’ll be taking one point as y-intercept and another when $ x = - 1 $ to form the line.
To find y-intercept make $ x = 0 $ in the equation
$
y = 3x + 1 \\
y = 3(0) + 1 \\
y = 1 \;
$
Now taking $ x = - 1 $
$
y = 3x + 1 \\
y = 3( - 1) + 1 \\
y = - 3 + 1 \\
y = - 2 \;
$
Forming the table of ordered pairs of points.
| x | 0 | -1 |
| y | 1 | -2 |
Now plotting points $ \left( {0,1} \right) $ and $ \left( { - 1, - 2} \right) $ and connecting them to form the line of the equation $ y = 3x + 1 $ .
Hence we’ve successfully plotted our graph of $ y = 3x + 1 $
Note: 1. Cartesian Plane: A Cartesian Plane is given its name by the French mathematician Rene Descartes ,who first used this plane in the field of mathematics .It is defined as the two mutually perpendicular number line , the one which is horizontal is given name x-axis and the one which is vertical is known as y-axis. With the help of these axes we can plot any point on this cartesian plane with the help of an ordered pair of numbers.
2.Draw the cartesian plane only with the help of a straight ruler and pencil to get the perfect and accurate results.
3.You can take any two points from the equation to plot the graph to the equation.

Recently Updated Pages
Master Class 8 English: Engaging Questions & Answers for Success
Master Class 8 Science: Engaging Questions & Answers for Success
Master Class 8 Maths: Engaging Questions & Answers for Success
Class 8 Question and Answer - Your Ultimate Solutions Guide
Master Class 8 Social Science: Engaging Questions & Answers for Success
Master Class 12 Economics: Engaging Questions & Answers for Success
Trending doubts
What is BLO What is the full form of BLO class 8 social science CBSE
Which Indian state shares the longest international class 8 social science CBSE
Citizens of India can vote at the age of A 18 years class 8 social science CBSE
Right to vote is a AFundamental Right BFundamental class 8 social science CBSE
Full form of STD, ISD and PCO
What is the area formula of an obtuse triangle class 8 maths CBSE