


How do you graph the line \[y = - 2\]?
Answer
600.6k+ views
Hint:In the above question, we need to plot the above line on the graph. Since, the given equation is a line where the equation of the straight line is \[y = mx + c\] so we can compare with this equation and find out the coordinates of the line on the cartesian plane.
Complete step by step solution:
In the above equation, we have to plot the line on the graph. To find the coordinates of the line what we can do is to select some values of x coordinate and then evaluate those values in the given equation where we get \[y = - 2\].
So, we will select a value for x i.e., zero and we substitute the value in \[y = mx + c\]
Where m is the slope of the equation and c is the constant term y-intercept. So substitute the value in equation we get,
\[y = m \times 0 + c\]
Since, y should always be equal to -2 so we use m=0 because whatever value we put for \[x\]will not matter as long m is zero.
Therefore y=-2 so c becomes -2. Here c is the y-intercept, so y-intercept means the line cutting the y - axis.
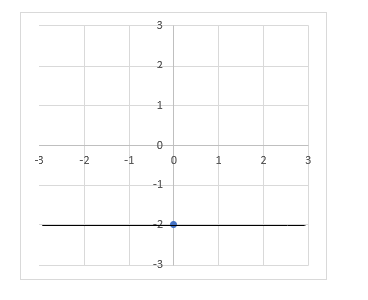
Therefore, the line is parallel to the x-axis because the value of slope is 0. Since it has no slope the line is in horizontal direction cutting the y-axis at point -2.
Note: An important thing to note is that slope contains the direction in which you go from one point to another. where \[m = \dfrac{y}{x} \Rightarrow \dfrac{{rise}}{{run}}\].The numerator tells you many steps to go up and down and denominator tell us how much steps to move left or right.
Complete step by step solution:
In the above equation, we have to plot the line on the graph. To find the coordinates of the line what we can do is to select some values of x coordinate and then evaluate those values in the given equation where we get \[y = - 2\].
So, we will select a value for x i.e., zero and we substitute the value in \[y = mx + c\]
Where m is the slope of the equation and c is the constant term y-intercept. So substitute the value in equation we get,
\[y = m \times 0 + c\]
Since, y should always be equal to -2 so we use m=0 because whatever value we put for \[x\]will not matter as long m is zero.
Therefore y=-2 so c becomes -2. Here c is the y-intercept, so y-intercept means the line cutting the y - axis.
Therefore, the line is parallel to the x-axis because the value of slope is 0. Since it has no slope the line is in horizontal direction cutting the y-axis at point -2.
Note: An important thing to note is that slope contains the direction in which you go from one point to another. where \[m = \dfrac{y}{x} \Rightarrow \dfrac{{rise}}{{run}}\].The numerator tells you many steps to go up and down and denominator tell us how much steps to move left or right.
Recently Updated Pages
Master Class 11 English: Engaging Questions & Answers for Success
Master Class 11 Social Science: Engaging Questions & Answers for Success
Master Class 11 Maths: Engaging Questions & Answers for Success
Master Class 11 Biology: Engaging Questions & Answers for Success
Master Class 11 Physics: Engaging Questions & Answers for Success
Master Class 11 Chemistry: Engaging Questions & Answers for Success
Trending doubts
One Metric ton is equal to kg A 10000 B 1000 C 100 class 11 physics CBSE
Difference Between Prokaryotic Cells and Eukaryotic Cells
Find the value of the expression given below sin 30circ class 11 maths CBSE
Difference between physical and chemical change class 11 chemistry CBSE
Two of the body parts which do not appear in MRI are class 11 biology CBSE
Draw a diagram of a plant cell and label at least eight class 11 biology CBSE