


How do you graph the line x = -5?
Answer
594.6k+ views
Hint: In this question we are given an equation of line and we need to draw a graph for that line. For this we will try to find the coordinate of the point by taking some value of y and finding the value of x. Since there is y in the equation so we will get a value of x as -5 for each value of y. Using these points we will draw a line on the graph.
Complete step by step answer:
Here we are given the equation of line as x = -5.
We need to draw a graph for this equation. For drawing a graph for any line we need some coordinates that can be plotted on the graph. The points will then be joined to get the equation of line.
For finding coordinates of a point we take some value of y and find value of x to get the points of the form (x,y).
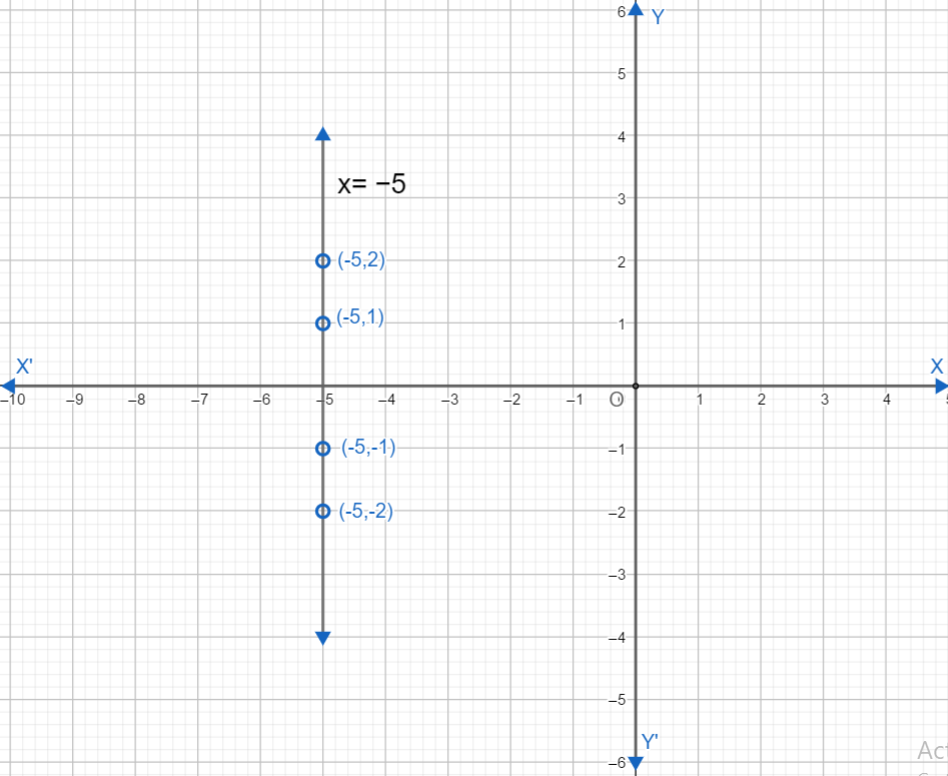
But here we can see that there is no y in the given equation of line. So we can observe that, if we put any value of y the value of x remains as -5. Hence all of the points will be in the form as (-5,y) where y can be any coordinate. To plot the graph let us consider some points to be plotted. Taking the value of y as 1 we get the point as (-5,1). Taking the value of y as 2 we get the point as (-5,2). Taking the value of y as -1 we get the point as (-5,-1). Taking the value of y as -2 we get the point as (-5,-2). Now let us plot the points (-5,1), (-5,2), (-5,-1), (-5,-2) on the graph and draw a line passing through these points. We will get the required line x = -5.
First let us draw x axis and y axis and mark the points. Then let us plot the points found and at last draw a straight line passing through these points. Our graph looks like this,
Note: Students should carefully plot the points taking care of negative x axis and negative y axis. Make sure to mark X for positive x axis, X' for negative x axis, Y for positive y axis and Y' for negative y axis. Draw a line joining all these points with proper sharpened pencil.
Complete step by step answer:
Here we are given the equation of line as x = -5.
We need to draw a graph for this equation. For drawing a graph for any line we need some coordinates that can be plotted on the graph. The points will then be joined to get the equation of line.
For finding coordinates of a point we take some value of y and find value of x to get the points of the form (x,y).
But here we can see that there is no y in the given equation of line. So we can observe that, if we put any value of y the value of x remains as -5. Hence all of the points will be in the form as (-5,y) where y can be any coordinate. To plot the graph let us consider some points to be plotted. Taking the value of y as 1 we get the point as (-5,1). Taking the value of y as 2 we get the point as (-5,2). Taking the value of y as -1 we get the point as (-5,-1). Taking the value of y as -2 we get the point as (-5,-2). Now let us plot the points (-5,1), (-5,2), (-5,-1), (-5,-2) on the graph and draw a line passing through these points. We will get the required line x = -5.
First let us draw x axis and y axis and mark the points. Then let us plot the points found and at last draw a straight line passing through these points. Our graph looks like this,
Note: Students should carefully plot the points taking care of negative x axis and negative y axis. Make sure to mark X for positive x axis, X' for negative x axis, Y for positive y axis and Y' for negative y axis. Draw a line joining all these points with proper sharpened pencil.
Recently Updated Pages
Master Class 12 Economics: Engaging Questions & Answers for Success
Master Class 12 English: Engaging Questions & Answers for Success
Master Class 12 Social Science: Engaging Questions & Answers for Success
Master Class 12 Maths: Engaging Questions & Answers for Success
Master Class 12 Physics: Engaging Questions & Answers for Success
Master Class 8 English: Engaging Questions & Answers for Success
Trending doubts
What is BLO What is the full form of BLO class 8 social science CBSE
Which Indian state shares the longest international class 8 social science CBSE
What are the 12 elements of nature class 8 chemistry CBSE
Citizens of India can vote at the age of A 18 years class 8 social science CBSE
Right to vote is a AFundamental Right BFundamental class 8 social science CBSE
Full form of STD, ISD and PCO