


How do you graph the line \[5x + 2y = 4?\]
Answer
582.9k+ views
Hint: This is very easy to solve the problem. To plot the graph, we definitely need some points that are to be plotted. Here we will not use any vague pointing; we will use the equation given and pick a value of x at random and find the value of y for the same equation. Like this we will get a pair of points x and y. Then we will repeat this for 4 more values. This collection of pairs so obtained will give the way out to plot the line. So let’s start!
Complete step-by-step answer:
Given that,
\[5x + 2y = 4\]
Now we will convert this equation in the form of y for our convenience.
\[y = \dfrac{{4 - 5x}}{2}\]
Now we will tabulate the values of x and respective values of y and then the pair of x and y.
Now using these values, we will plot the points on the graph one by one and on joining them we will get the line.
Note: Here note that the line is just a straight line. The point we plotted definitely satisfies the equation given above. If we go with any other method like taking the slope or else. In taking the slope is the ratio of the difference between the two points of y axis and two points of x axis from the equation only in the form of y=mx+c.
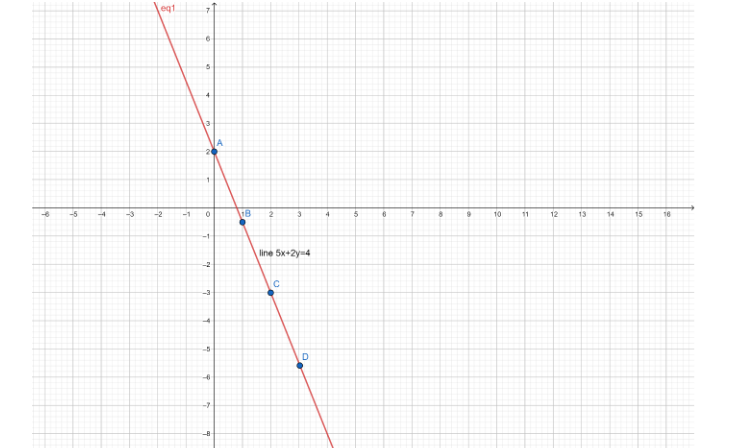
Complete step-by-step answer:
Given that,
\[5x + 2y = 4\]
Now we will convert this equation in the form of y for our convenience.
\[y = \dfrac{{4 - 5x}}{2}\]
Now we will tabulate the values of x and respective values of y and then the pair of x and y.
| Value of x | Value of y | (x,y) |
| x=0 | \[y = \dfrac{{4 - 5 \times 0}}{2} = \dfrac{{4 - 0}}{2} = \dfrac{4}{2} = 2\] | \[\left( {0,2} \right)\] |
| x=1 | \[y = \dfrac{{4 - 5 \times 1}}{2} = \dfrac{{4 - 5}}{2} = \dfrac{{ - 1}}{2} = - 0.5\] | \[\left( {1, - 0.5} \right)\] |
| x=2 | \[y = \dfrac{{4 - 5 \times 2}}{2} = \dfrac{{4 - 10}}{2} = \dfrac{{ - 6}}{2} = - 3\] | \[\left( {2, - 3} \right)\] |
| x=3 | \[y = \dfrac{{4 - 5 \times 3}}{2} = \dfrac{{4 - 15}}{2} = \dfrac{{ - 11}}{2} = - 5.5\] | \[\left( {3, - 5.5} \right)\] |
Now using these values, we will plot the points on the graph one by one and on joining them we will get the line.
Note: Here note that the line is just a straight line. The point we plotted definitely satisfies the equation given above. If we go with any other method like taking the slope or else. In taking the slope is the ratio of the difference between the two points of y axis and two points of x axis from the equation only in the form of y=mx+c.

Recently Updated Pages
Basicity of sulphurous acid and sulphuric acid are
Master Class 12 Economics: Engaging Questions & Answers for Success
Master Class 12 Biology: Engaging Questions & Answers for Success
Master Class 11 English: Engaging Questions & Answers for Success
Master Class 11 Physics: Engaging Questions & Answers for Success
Master Class 11 Computer Science: Engaging Questions & Answers for Success
Trending doubts
What is BLO What is the full form of BLO class 8 social science CBSE
Citizens of India can vote at the age of A 18 years class 8 social science CBSE
Full form of STD, ISD and PCO
Give me the opposite gender of Duck class 8 english CBSE
What is the feminine gender of a stag class 8 english CBSE
One cusec is equal to how many liters class 8 maths CBSE