


How do you graph the inequality \[y > - 1\] ?
Answer
575.4k+ views
Hint:First we need to draw the graph of the equation\[y = - 1\] . We use intercept form to draw the graph. That is we find the coordinate of the given equation lying on the line of x- axis, we can find this by substituting the value of ‘y’ is equal to zero (x-intercept). Similarly we can find the coordinate of the equation lying on the line of y- axis, we can find this by substituting the value of ‘x’ equal to zero (y-intercept). After drawing the graph we can check in which region the inequality satisfies. Here if we draw \[y > - 1\] we will have a parallel line to x-axis.
Complete step by step answer:
Given, \[y > - 1\]. Now consider \[y = - 1\].
For \[y = - 1\].
Here we don’t have an ‘x’ variable in the given equation. So ‘y’ will always equal to \[ - 1\], no matter what value we put in for ‘x’, the ‘y’ is always going to be \[ - 1\]. That is,
Let’s plot a graph for these coordinates. We take scale x-axis= 1 unit = 1 units and y-axis= 1 unit = 1 units.
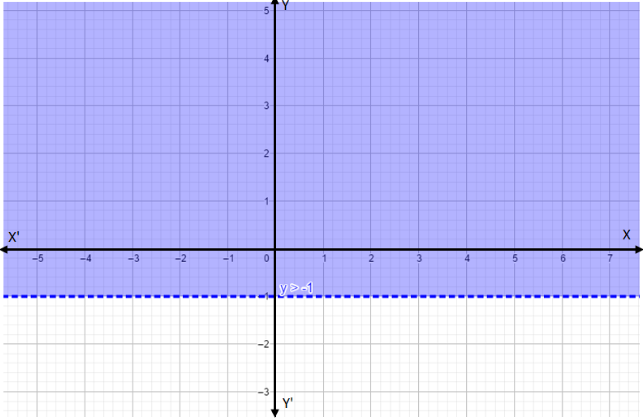
We expanded the point touching the intercepts. We took a coordinate above and below the equation of line (see in above graph).For \[y > - 1\], we can see in the graph that we have a straight horizontal line that crosses the y axis at \[ - 1\]. The solution is all the coordinate points above the line \[y = - 1\]. If we take coordinate points below the line the inequality won’t be satisfied. In the above graph the shaded region is the solution of the given inequality.
Note: We don’t take points lying on the line \[y = - 1\] for the inequality \[y > - 1\]. A graph shows the relation between two variable quantities, it contains two axes perpendicular to each other namely the x-axis and the y-axis. Each variable is measured along one of the axes. In the question, we are given one linear equation containing two variables namely x and y, x is measured along the x-axis and y is measured along the y-axis while tracing the given equations.
Complete step by step answer:
Given, \[y > - 1\]. Now consider \[y = - 1\].
For \[y = - 1\].
Here we don’t have an ‘x’ variable in the given equation. So ‘y’ will always equal to \[ - 1\], no matter what value we put in for ‘x’, the ‘y’ is always going to be \[ - 1\]. That is,
| \[x\] | \[1\] | \[ - 1\] | \[2\] | \[ - 2\] | \[3\] | \[ - 3\] | \[4\] | \[ - 4\] |
| \[y\] | \[ - 1\] | \[ - 1\] | \[ - 1\] | \[ - 1\] | \[ - 1\] | \[ - 1\] | \[ - 1\] | \[ - 1\] |
Let’s plot a graph for these coordinates. We take scale x-axis= 1 unit = 1 units and y-axis= 1 unit = 1 units.
We expanded the point touching the intercepts. We took a coordinate above and below the equation of line (see in above graph).For \[y > - 1\], we can see in the graph that we have a straight horizontal line that crosses the y axis at \[ - 1\]. The solution is all the coordinate points above the line \[y = - 1\]. If we take coordinate points below the line the inequality won’t be satisfied. In the above graph the shaded region is the solution of the given inequality.
Note: We don’t take points lying on the line \[y = - 1\] for the inequality \[y > - 1\]. A graph shows the relation between two variable quantities, it contains two axes perpendicular to each other namely the x-axis and the y-axis. Each variable is measured along one of the axes. In the question, we are given one linear equation containing two variables namely x and y, x is measured along the x-axis and y is measured along the y-axis while tracing the given equations.
Recently Updated Pages
Master Class 11 Social Science: Engaging Questions & Answers for Success
Master Class 11 Chemistry: Engaging Questions & Answers for Success
Master Class 12 Business Studies: Engaging Questions & Answers for Success
Master Class 12 Chemistry: Engaging Questions & Answers for Success
Master Class 12 Biology: Engaging Questions & Answers for Success
Class 12 Question and Answer - Your Ultimate Solutions Guide
Trending doubts
One Metric ton is equal to kg A 10000 B 1000 C 100 class 11 physics CBSE
Difference Between Prokaryotic Cells and Eukaryotic Cells
Two of the body parts which do not appear in MRI are class 11 biology CBSE
Explain zero factorial class 11 maths CBSE
10 examples of friction in our daily life
Name the Largest and the Smallest Cell in the Human Body ?