


How do you graph the inequality \[x<1\]?
Answer
584.7k+ views
Hint: In this problem, we have to graph the given inequality \[x<1\]. We know that the inequality is a relation which makes a non-equal comparison between two numbers or other mathematical expressions. It is used most often to compare two numbers on the number line by their size. To graph the given inequality, we will draw a vertical line at 1 on the horizontal axis. The line will be a dashed line because the inequality operator does not contain an ‘equal to’ clause.
Complete step by step answer:
We know that the given inequality is \[x<1\].
Now we can graph the inequality.
We can draw a vertical line at the point 1 on the x-axis, the line will be a dashed line as it is an inequality operator.
We will shade to the left side of the line because the inequality operator contains a less than symbol.
Now we can draw the graph.
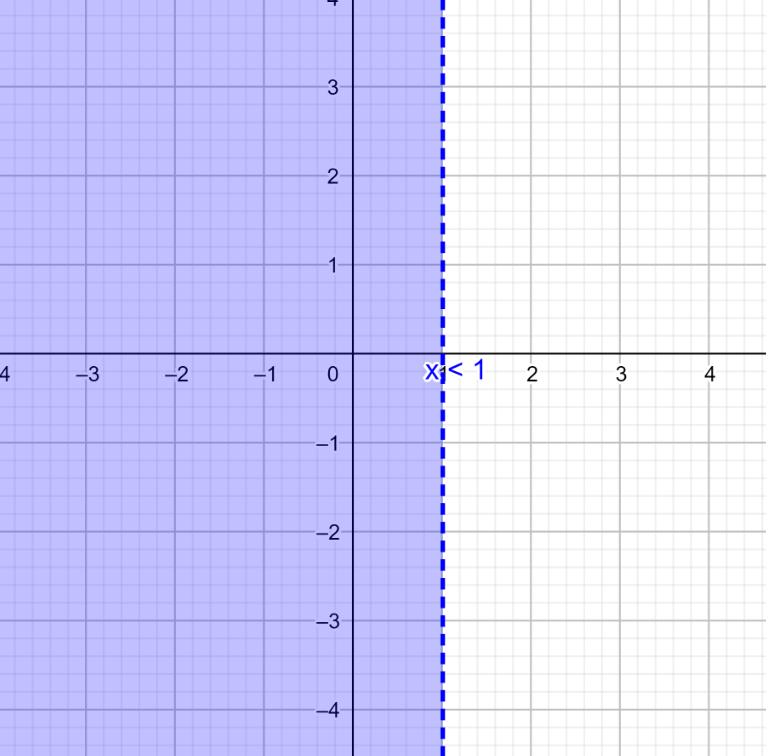
Here, the line will be a dashed line because the inequality operator does not contain an equal to clause.
Note: We should know about inequalities and understand the basic concepts of inequalities to solve these types of problems. In this problem, we have given the less than symbol in \[x<1\], where the left side of 1 should be shaded. If we have the greater than symbol, then the graph should be shaded to the right side of the point
Complete step by step answer:
We know that the given inequality is \[x<1\].
Now we can graph the inequality.
We can draw a vertical line at the point 1 on the x-axis, the line will be a dashed line as it is an inequality operator.
We will shade to the left side of the line because the inequality operator contains a less than symbol.
Now we can draw the graph.
Here, the line will be a dashed line because the inequality operator does not contain an equal to clause.
Note: We should know about inequalities and understand the basic concepts of inequalities to solve these types of problems. In this problem, we have given the less than symbol in \[x<1\], where the left side of 1 should be shaded. If we have the greater than symbol, then the graph should be shaded to the right side of the point
Recently Updated Pages
Master Class 12 Business Studies: Engaging Questions & Answers for Success
Master Class 12 Biology: Engaging Questions & Answers for Success
Master Class 12 Chemistry: Engaging Questions & Answers for Success
Class 12 Question and Answer - Your Ultimate Solutions Guide
Master Class 11 Social Science: Engaging Questions & Answers for Success
Master Class 11 English: Engaging Questions & Answers for Success
Trending doubts
What is BLO What is the full form of BLO class 8 social science CBSE
Citizens of India can vote at the age of A 18 years class 8 social science CBSE
Right to vote is a AFundamental Right BFundamental class 8 social science CBSE
10 slogans on organ donation class 8 english CBSE
Name the states through which the Tropic of Cancer class 8 social science CBSE
What are the 12 elements of nature class 8 chemistry CBSE