


How do you graph the inequality $x < - 2$ ?
Answer
597.6k+ views
Hint: Start by graphing the line $x = - 2$. Check the condition of the inequality carefully and shade the region that includes all the points whose x coordinate is less than -2.
Complete Step by Step Solution:
To graph the inequality $x < - 2$ we need to start by graphing the line $x = - 2$.
The general equation of a straight line is $y = mx + c$, however, there’s no y-intercept in the above equation. The equation thus has the general form $x = - a$.
The graph of $x = - 2$ is a vertical line drawn parallel to the y-axis passing through all the points in the 2-dimensional plane having x coordinate equal to -2.
The graph is as follows:
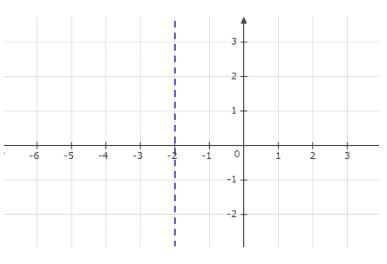
We draw a vertical dashed line representing $x = - 2$ . The dashed line is used because it indicates that the line $x = - 2$ forms the boundary of the given inequality. An important point to note is that the line is not a part of it. To obtain the final graph representing the inequality, we must shade the part of the graph to the left of the dashed line. The range of the shaded region can be defined as $( - \infty , - 2)$.
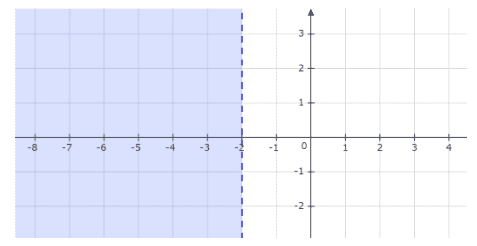
This is the graph of the inequality $x < - 2$
Note:
Common errors:
Not flipping the inequality sign when one divides by a negative number or variable.
Misidentifying the type of inequality which further leads to solving it incorrectly, i.e., one might include the endpoint, -2 in this question and end up graphing the inequality $x \leqslant - 2$ instead of $x < - 2$.
Complete Step by Step Solution:
To graph the inequality $x < - 2$ we need to start by graphing the line $x = - 2$.
The general equation of a straight line is $y = mx + c$, however, there’s no y-intercept in the above equation. The equation thus has the general form $x = - a$.
The graph of $x = - 2$ is a vertical line drawn parallel to the y-axis passing through all the points in the 2-dimensional plane having x coordinate equal to -2.
The graph is as follows:
We draw a vertical dashed line representing $x = - 2$ . The dashed line is used because it indicates that the line $x = - 2$ forms the boundary of the given inequality. An important point to note is that the line is not a part of it. To obtain the final graph representing the inequality, we must shade the part of the graph to the left of the dashed line. The range of the shaded region can be defined as $( - \infty , - 2)$.
This is the graph of the inequality $x < - 2$
Note:
Common errors:
Not flipping the inequality sign when one divides by a negative number or variable.
Misidentifying the type of inequality which further leads to solving it incorrectly, i.e., one might include the endpoint, -2 in this question and end up graphing the inequality $x \leqslant - 2$ instead of $x < - 2$.
Recently Updated Pages
Master Class 11 English: Engaging Questions & Answers for Success
Master Class 11 Social Science: Engaging Questions & Answers for Success
Master Class 11 Maths: Engaging Questions & Answers for Success
Master Class 11 Biology: Engaging Questions & Answers for Success
Master Class 11 Physics: Engaging Questions & Answers for Success
Master Class 11 Chemistry: Engaging Questions & Answers for Success
Trending doubts