


How do you graph the function $y=x-1?$
Answer
563.4k+ views
Hint: First we will take some numbers randomly as $x$ values to graph the function. And then we will substitute those numbers for $x$ in the given function to find the corresponding $y$ values. So, we will get as many points as the $x$ values taken.
Complete step by step solution:
Let us consider the given function $y=x-1.$
We are asked to graph the given function. To graph the function, we need to find the coordinate points $\left( x,y \right)$ that satisfy the function when substituted for the respective variables.
In the expression, we can see that the value of $y$ changes according to the value of $x.$ So, the variable $x$ is independent and the variable $y$ is dependent. Therefore, we are free to choose two or three numbers randomly for the variable $x.$And we will get corresponding $y$ values.
We are going to choose the numbers $0,1$ and $2$ as $x$ values.
Using these values, we are going to find the $y$ values we need.
When we substitute $0$ in the place of $x$ in $y=x-1,$ we will get $y=0-1=-1.$
When we substitute $x=1$ in the given function, we will get $y=1-1=0.$
And when we substitute $x=2,$ that will give us $y=2-1=1.$
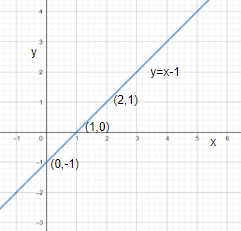
So, the three points we have found in order to graph the given function are $\left( 0,-1 \right),\left( 1,0 \right)$ and $\left( 2,1 \right).$
We can plot the graph using these points.
Hence the graph of the function $y=x-1$ is obtained as
Note: When we draw a graph, we need to mark at least two points through which the required curve passes on the plane. When we join these two points, we will get the required curve.
Complete step by step solution:
Let us consider the given function $y=x-1.$
We are asked to graph the given function. To graph the function, we need to find the coordinate points $\left( x,y \right)$ that satisfy the function when substituted for the respective variables.
In the expression, we can see that the value of $y$ changes according to the value of $x.$ So, the variable $x$ is independent and the variable $y$ is dependent. Therefore, we are free to choose two or three numbers randomly for the variable $x.$And we will get corresponding $y$ values.
We are going to choose the numbers $0,1$ and $2$ as $x$ values.
Using these values, we are going to find the $y$ values we need.
When we substitute $0$ in the place of $x$ in $y=x-1,$ we will get $y=0-1=-1.$
When we substitute $x=1$ in the given function, we will get $y=1-1=0.$
And when we substitute $x=2,$ that will give us $y=2-1=1.$
So, the three points we have found in order to graph the given function are $\left( 0,-1 \right),\left( 1,0 \right)$ and $\left( 2,1 \right).$
We can plot the graph using these points.
Hence the graph of the function $y=x-1$ is obtained as
Note: When we draw a graph, we need to mark at least two points through which the required curve passes on the plane. When we join these two points, we will get the required curve.
Recently Updated Pages
Master Class 11 Economics: Engaging Questions & Answers for Success
Master Class 11 English: Engaging Questions & Answers for Success
Master Class 11 Maths: Engaging Questions & Answers for Success
Class 11 Question and Answer - Your Ultimate Solutions Guide
Master Class 11 Social Science: Engaging Questions & Answers for Success
Master Class 11 Business Studies: Engaging Questions & Answers for Success
Trending doubts
One Metric ton is equal to kg A 10000 B 1000 C 100 class 11 physics CBSE
There are 720 permutations of the digits 1 2 3 4 5 class 11 maths CBSE
Differentiate between an exothermic and an endothermic class 11 chemistry CBSE
In what year Guru Nanak Dev ji was born A15 April 1469 class 11 social science CBSE
Difference Between Prokaryotic Cells and Eukaryotic Cells
State and prove Bernoullis theorem class 11 physics CBSE