


How do you graph the function $y=-5x+1$?
Answer
528.9k+ views
Hint: Change of form of the given equation will give the x-intercept and y-intercept of the line. We change it to the form of $\dfrac{x}{p}+\dfrac{y}{q}=1$ to find the x intercept, and y intercept of the line as $p$ and $q$ respectively. Then we place the points on the axes and from there we draw the line on the graph.
Complete answer:
We are taking the general equation of line to understand the slope and the intercept form of the line $y=-5x+1$. We convert the given equation into the form of $\dfrac{x}{p}+\dfrac{y}{q}=1$. We get that the x intercept, and y intercept of the line will be$p$ and $q$ respectively. The points will be $\left( p,0 \right),\left( 0,q \right)$.
The given equation is $y=-5x+1$. Converting into the form of $\dfrac{x}{p}+\dfrac{y}{q}=1$, we get
$\begin{align}
& y=-5x+1 \\
& \Rightarrow 5x+y=1 \\
& \Rightarrow \dfrac{x}{{}^{1}/{}_{5}}+\dfrac{y}{1}=1 \\
\end{align}$
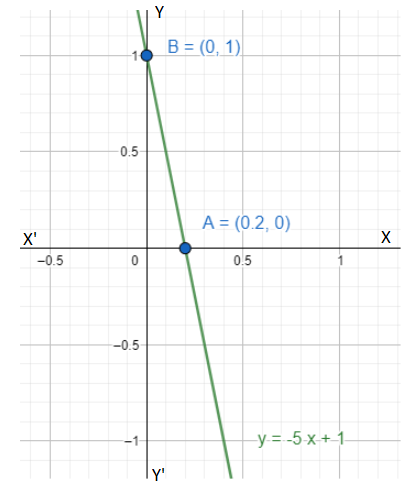
Therefore, the x intercept, and y intercept of the line $y=-5x+1$ is $\dfrac{1}{5}$ and 1 respectively. The axes intersecting points are $\left( \dfrac{1}{5},0 \right),\left( 0,1 \right)$. We now plot these points and get the line.
Note:
A line parallel to the X-axis does not intersect the X-axis at any finite distance. Hence, we cannot get any finite x-intercept of such a line. Same goes for lines parallel to the Y-axis. In case of slope of a line the range of the slope is 0 to $\infty $.
Complete answer:
We are taking the general equation of line to understand the slope and the intercept form of the line $y=-5x+1$. We convert the given equation into the form of $\dfrac{x}{p}+\dfrac{y}{q}=1$. We get that the x intercept, and y intercept of the line will be$p$ and $q$ respectively. The points will be $\left( p,0 \right),\left( 0,q \right)$.
The given equation is $y=-5x+1$. Converting into the form of $\dfrac{x}{p}+\dfrac{y}{q}=1$, we get
$\begin{align}
& y=-5x+1 \\
& \Rightarrow 5x+y=1 \\
& \Rightarrow \dfrac{x}{{}^{1}/{}_{5}}+\dfrac{y}{1}=1 \\
\end{align}$
Therefore, the x intercept, and y intercept of the line $y=-5x+1$ is $\dfrac{1}{5}$ and 1 respectively. The axes intersecting points are $\left( \dfrac{1}{5},0 \right),\left( 0,1 \right)$. We now plot these points and get the line.
Note:
A line parallel to the X-axis does not intersect the X-axis at any finite distance. Hence, we cannot get any finite x-intercept of such a line. Same goes for lines parallel to the Y-axis. In case of slope of a line the range of the slope is 0 to $\infty $.
Recently Updated Pages
Master Class 10 Social Science: Engaging Questions & Answers for Success
Master Class 10 Science: Engaging Questions & Answers for Success
Master Class 10 Maths: Engaging Questions & Answers for Success
Master Class 10 General Knowledge: Engaging Questions & Answers for Success
Master Class 10 Computer Science: Engaging Questions & Answers for Success
Class 10 Question and Answer - Your Ultimate Solutions Guide
Trending doubts
What is the full form of PNG A Petrol Natural Gas B class 10 chemistry CBSE
Explain the Treaty of Vienna of 1815 class 10 social science CBSE
In cricket, how many legal balls are there in a standard over?
Why is there a time difference of about 5 hours between class 10 social science CBSE
Who Won 36 Oscar Awards? Record Holder Revealed
What is the median of the first 10 natural numbers class 10 maths CBSE