


How do you graph the function f(x) = -5X?
Answer
558.3k+ views
Hint: In the given question, an equation needs to be solved which is in the form of a linear equation in one variable. General form of the equation of a straight line i.e. y = mx + c will be used. The intercept c is missing but the slope is given as -5. The obtained value will be finally plotted on the graph.
Complete step by step answer:
Now, let’s discuss the question now.
We already know that the slope-intercept form is a general form of a straight line and is expressed as y = mx + c where ‘m’ is a slope and c is a constant and intercepts are m and c.So, for plotting a straight line, first we have to convert the given equation in a slope-intercept form.
Let’s assume that f is a function of x that is equal to the value x for all real numbers x.
If we see the equation, here intercept is not given. The only possible way is if f(x) is a straight line through the origin with a slope of 1. There is no other option.
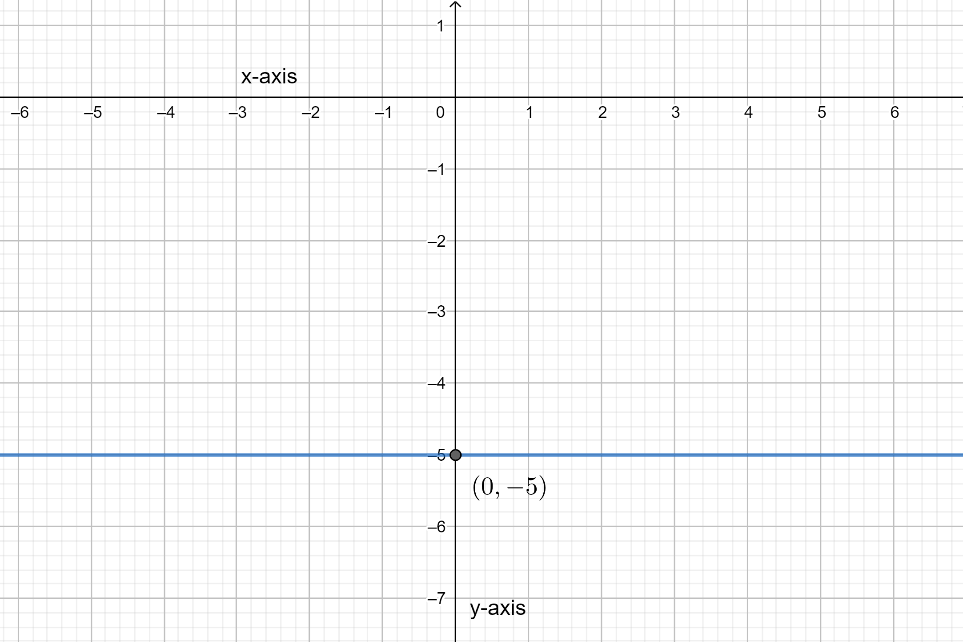
So, in slope-intercept form:
$\Rightarrow y=-5x+0$
Put x = 1, we will get:
$\Rightarrow $y = -5
Let’s plot the graph now.
Note: We plot the points by slope and intercept form so that it becomes easy so solve for a particular variable the way we performed here. It is the easiest approach of finding the coordinates of any line. All you need to remember is the general form of the equation of a straight line.
Complete step by step answer:
Now, let’s discuss the question now.
We already know that the slope-intercept form is a general form of a straight line and is expressed as y = mx + c where ‘m’ is a slope and c is a constant and intercepts are m and c.So, for plotting a straight line, first we have to convert the given equation in a slope-intercept form.
Let’s assume that f is a function of x that is equal to the value x for all real numbers x.
If we see the equation, here intercept is not given. The only possible way is if f(x) is a straight line through the origin with a slope of 1. There is no other option.
So, in slope-intercept form:
$\Rightarrow y=-5x+0$
Put x = 1, we will get:
$\Rightarrow $y = -5
Let’s plot the graph now.
Note: We plot the points by slope and intercept form so that it becomes easy so solve for a particular variable the way we performed here. It is the easiest approach of finding the coordinates of any line. All you need to remember is the general form of the equation of a straight line.
Recently Updated Pages
Master Class 11 Computer Science: Engaging Questions & Answers for Success
Master Class 11 Business Studies: Engaging Questions & Answers for Success
Master Class 11 Economics: Engaging Questions & Answers for Success
Master Class 11 English: Engaging Questions & Answers for Success
Master Class 11 Maths: Engaging Questions & Answers for Success
Master Class 11 Biology: Engaging Questions & Answers for Success
Trending doubts
One Metric ton is equal to kg A 10000 B 1000 C 100 class 11 physics CBSE
There are 720 permutations of the digits 1 2 3 4 5 class 11 maths CBSE
Discuss the various forms of bacteria class 11 biology CBSE
Draw a diagram of a plant cell and label at least eight class 11 biology CBSE
State the laws of reflection of light
Explain zero factorial class 11 maths CBSE