


How do you graph the equation \[y = 3x\]?
Answer
603.6k+ views
Hint: In the given question, it is asked to graph the line \[y = 3x\]. First we will compare it with slope Intercept Form i. e., \[y = mx + c\]. We get that the intercept on the y-axis is \[0\] meaning the line will pass through the origin and slope of the line is \[3\].
Complete step-by-step answer:
The given equation of the line is \[y = 3x\].
We need to put the equation in Slope Intercept Form i. e., \[y = mx + c\]
Here we have, \[y = 3x + 0\] , so we get \[m = 3\]
We will graph the y-intercept point (the number in the b position) on the y-axis.
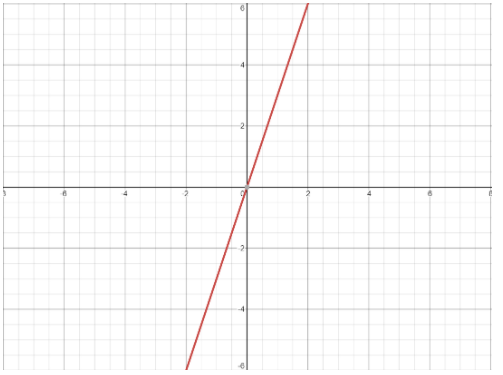
Here when we put \[x = 0\], we get \[y = 0\]. So, we get one point as (\[0,0\]).
Now, we find our second point with the help of a given equation.
Here, if we put \[x = 1\] then we get \[y = 3\]. So, the 2nd point is (\[1,3\]).
After finding these two points, we will plot it on the graph. Later, we draw the line using the two points we have plotted.
Therefore, we get our required graph.
Additional Information:
The graph of a linear equation \[Ax + By = C\] is a line. Every point on the line is a solution of the equation. Every solution of this equation is a point on this line.
Note: So, for solving questions of such type, we first analyse what has been given to us. Then we carefully write down what we have to find. \[y = 3x\] is a simple linear equation. To graph a linear equation \[y = 3x\] , it means to draw a line in the 2-D plane. We get that the intercept on the y-axis is \[0\] meaning the line will pass through the origin and slope of the line is \[3\]. However, graphing this line is fairly straightforward. For every value of \[x\] in real numbers, Y is \[3\] times that value of x.
Complete step-by-step answer:
The given equation of the line is \[y = 3x\].
We need to put the equation in Slope Intercept Form i. e., \[y = mx + c\]
Here we have, \[y = 3x + 0\] , so we get \[m = 3\]
We will graph the y-intercept point (the number in the b position) on the y-axis.
Here when we put \[x = 0\], we get \[y = 0\]. So, we get one point as (\[0,0\]).
Now, we find our second point with the help of a given equation.
Here, if we put \[x = 1\] then we get \[y = 3\]. So, the 2nd point is (\[1,3\]).
After finding these two points, we will plot it on the graph. Later, we draw the line using the two points we have plotted.
Therefore, we get our required graph.
Additional Information:
The graph of a linear equation \[Ax + By = C\] is a line. Every point on the line is a solution of the equation. Every solution of this equation is a point on this line.
Note: So, for solving questions of such type, we first analyse what has been given to us. Then we carefully write down what we have to find. \[y = 3x\] is a simple linear equation. To graph a linear equation \[y = 3x\] , it means to draw a line in the 2-D plane. We get that the intercept on the y-axis is \[0\] meaning the line will pass through the origin and slope of the line is \[3\]. However, graphing this line is fairly straightforward. For every value of \[x\] in real numbers, Y is \[3\] times that value of x.
Recently Updated Pages
Master Class 11 English: Engaging Questions & Answers for Success
Master Class 11 Social Science: Engaging Questions & Answers for Success
Master Class 11 Maths: Engaging Questions & Answers for Success
Master Class 11 Biology: Engaging Questions & Answers for Success
Master Class 11 Physics: Engaging Questions & Answers for Success
Master Class 11 Chemistry: Engaging Questions & Answers for Success
Trending doubts
Explain the Treaty of Vienna of 1815 class 10 social science CBSE
What is the Total Duration of Football Match?
First Cotton Mill of India
In which year voting age was reduced from 21 to 18?
10 examples of evaporation in daily life with explanations
What planets have no moons Which one has only one moon class 10 physics CBSE