


How do you graph $r=\theta $ ?
Answer
544.5k+ views
Hint: We know that $\left( r,\theta \right)$ are polar coordinates, where r is the distance between the point and origin and $\theta $ is the angle between the line joining the origin and the point on X-axis. We will start substituting the value of $\theta $ from zero and increase gradually to find the desired answer.
Complete step by step solution:
We have given an expression $r=\theta $.
We have to plot a graph for the given equation.
Now, we know that $\left( r,\theta \right)$ are polar coordinates, where r is the distance between the point and origin and $\theta $ is the angle between the line joining the origin and the point on X-axis.
Now, we know that the value of $\theta $ starts from zero i.e. from origin and goes in the counter clockwise direction. The graph goes curved when the value of $\theta $ increases.
When the value of $\theta $ increases from $0\text{ to }\dfrac{\pi }{2}$ the graph goes in the counterclockwise direction and farther from the origin because the Cartesian coordinates will be
$\Rightarrow x=r\cos \theta $ and $y=r\sin \theta $
When $\theta =\dfrac{\pi }{2}$ we will get
$\Rightarrow x=r\cos \dfrac{\pi }{2}$ and $y=r\sin \dfrac{\pi }{2}$
$\Rightarrow x=\dfrac{\pi }{2}\times 0$ and $y=\dfrac{\pi }{2}\times 1$
$\Rightarrow x=0$ and $y=\dfrac{\pi }{2}$
So the graph intercepts the Y-axis at $\dfrac{\pi }{2}$.
Similarly when $\theta $ increases from to $\pi $ the graph intercepts X-axis at $\pi $.
We will get the graph as
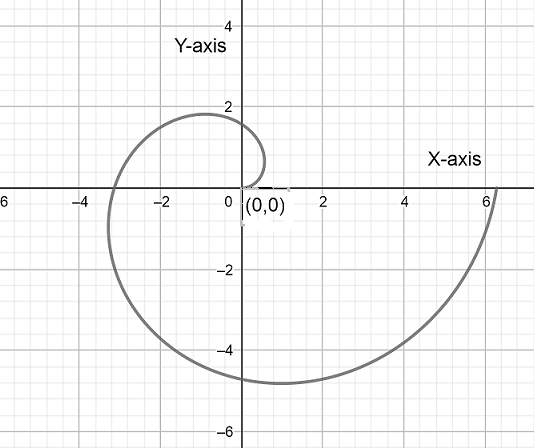
Hence above is the required graph of the given expression.
Note: To plot a graph first we need to find the values of Cartesian coordinates. Then by finding some values of points we will draw a graph. We need to write r and $\theta $ in terms of x and y to plot a graph in a Cartesian plane.
Complete step by step solution:
We have given an expression $r=\theta $.
We have to plot a graph for the given equation.
Now, we know that $\left( r,\theta \right)$ are polar coordinates, where r is the distance between the point and origin and $\theta $ is the angle between the line joining the origin and the point on X-axis.
Now, we know that the value of $\theta $ starts from zero i.e. from origin and goes in the counter clockwise direction. The graph goes curved when the value of $\theta $ increases.
When the value of $\theta $ increases from $0\text{ to }\dfrac{\pi }{2}$ the graph goes in the counterclockwise direction and farther from the origin because the Cartesian coordinates will be
$\Rightarrow x=r\cos \theta $ and $y=r\sin \theta $
When $\theta =\dfrac{\pi }{2}$ we will get
$\Rightarrow x=r\cos \dfrac{\pi }{2}$ and $y=r\sin \dfrac{\pi }{2}$
$\Rightarrow x=\dfrac{\pi }{2}\times 0$ and $y=\dfrac{\pi }{2}\times 1$
$\Rightarrow x=0$ and $y=\dfrac{\pi }{2}$
So the graph intercepts the Y-axis at $\dfrac{\pi }{2}$.
Similarly when $\theta $ increases from to $\pi $ the graph intercepts X-axis at $\pi $.
We will get the graph as
Hence above is the required graph of the given expression.
Note: To plot a graph first we need to find the values of Cartesian coordinates. Then by finding some values of points we will draw a graph. We need to write r and $\theta $ in terms of x and y to plot a graph in a Cartesian plane.
Recently Updated Pages
Basicity of sulphurous acid and sulphuric acid are
Master Class 11 Business Studies: Engaging Questions & Answers for Success
Master Class 11 Computer Science: Engaging Questions & Answers for Success
Master Class 11 Economics: Engaging Questions & Answers for Success
Master Class 11 Social Science: Engaging Questions & Answers for Success
Master Class 11 English: Engaging Questions & Answers for Success
Trending doubts
One Metric ton is equal to kg A 10000 B 1000 C 100 class 11 physics CBSE
The largest wind power cluster is located in the state class 11 social science CBSE
Explain zero factorial class 11 maths CBSE
State and prove Bernoullis theorem class 11 physics CBSE
Which among the following are examples of coming together class 11 social science CBSE
Can anyone list 10 advantages and disadvantages of friction