


How do you graph rational functions?
Answer
580.8k+ views
Hint: A rational function is any function which can be written as the ratio of two polynomial functions and the denominator is not equal to zero. We can graph rational functions, by finding their intercepts, horizontal and vertical intercepts. Hence based on this we can graph the rational functions with respect to their Asymptotes.
Complete step by step solution:
As we know rational functions are the ratio of two polynomial functions where the denominator polynomial is not equal to zero.
To graph rational function,
Find the intercepts, if there are any. Then find the vertical asymptotes by setting the denominator equal to zero and solving.
We need to find the horizontal asymptote, if it exists, using the fact above and the vertical asymptotes will divide the number line into regions. And then sketch the graph.
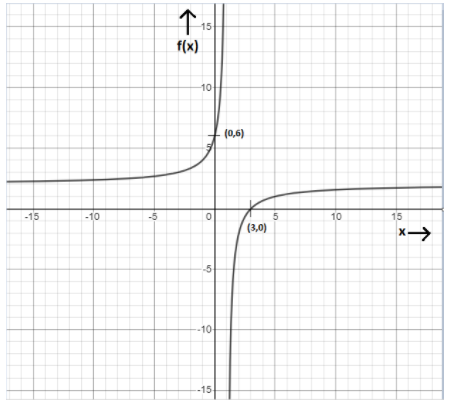
Let’s sketch the graph of \[f\left( x \right) = \dfrac{{6 - 2x}}{{1 - x}}\] . First, since this is a rational function, we are going to have to be careful with division by zero issues.
Let’s first find the intercepts for this function.
The y-intercept is the point \[\left( {0,f\left( 0 \right)} \right) = \left( {0,6} \right)\]
For the x-intercepts we set the numerator equal to zero and solve. Doing that for this problem gives,
\[6 - 2x = 0\]
\[ \Rightarrow x = 3\]
So, the only x-intercept for this sum is (3,0).
We can find any vertical asymptotes by setting the denominator equal to zero and solving. Doing that for this function gives,
\[\begin{gathered}
1 - x = 0 \\
\Rightarrow x = 1 \\
\end{gathered} \] …………………… 1
So, we’ll have a vertical asymptote at x=1.
For this equation the largest exponent of x in both the numerator and denominator is 1. Therefore, the horizontal asymptote for this problem is then the coefficient of the x in the numerator divided by the coefficient of the x in the denominator as
\[y = \dfrac{{ - 2}}{{ - 1}} = 2\]
From equation 1 we saw we only have one vertical asymptote and so we only have two regions to our graph: \[x < 1\] and \[x > 1\].
We’ll need a point in each region to determine if it will be above or below the horizontal asymptote. Here are a couple of function evaluations for the points.
\[f\left( 0 \right) = 6 \to \left( {0,6} \right)\]
\[f\left( 3 \right) = 0 \to \left( {3,0} \right)\]
Note:
In our graph as the value of x approaches x=0 the graph starts getting very large on both sides of the line given by x=0. This line is called a vertical asymptote. Also, as x gets very large, both positive and negative, the graph approaches the line given by y=0. This line is called a horizontal asymptote.
Complete step by step solution:
As we know rational functions are the ratio of two polynomial functions where the denominator polynomial is not equal to zero.
To graph rational function,
Find the intercepts, if there are any. Then find the vertical asymptotes by setting the denominator equal to zero and solving.
We need to find the horizontal asymptote, if it exists, using the fact above and the vertical asymptotes will divide the number line into regions. And then sketch the graph.
Let’s sketch the graph of \[f\left( x \right) = \dfrac{{6 - 2x}}{{1 - x}}\] . First, since this is a rational function, we are going to have to be careful with division by zero issues.
Let’s first find the intercepts for this function.
The y-intercept is the point \[\left( {0,f\left( 0 \right)} \right) = \left( {0,6} \right)\]
For the x-intercepts we set the numerator equal to zero and solve. Doing that for this problem gives,
\[6 - 2x = 0\]
\[ \Rightarrow x = 3\]
So, the only x-intercept for this sum is (3,0).
We can find any vertical asymptotes by setting the denominator equal to zero and solving. Doing that for this function gives,
\[\begin{gathered}
1 - x = 0 \\
\Rightarrow x = 1 \\
\end{gathered} \] …………………… 1
So, we’ll have a vertical asymptote at x=1.
For this equation the largest exponent of x in both the numerator and denominator is 1. Therefore, the horizontal asymptote for this problem is then the coefficient of the x in the numerator divided by the coefficient of the x in the denominator as
\[y = \dfrac{{ - 2}}{{ - 1}} = 2\]
From equation 1 we saw we only have one vertical asymptote and so we only have two regions to our graph: \[x < 1\] and \[x > 1\].
We’ll need a point in each region to determine if it will be above or below the horizontal asymptote. Here are a couple of function evaluations for the points.
\[f\left( 0 \right) = 6 \to \left( {0,6} \right)\]
\[f\left( 3 \right) = 0 \to \left( {3,0} \right)\]
Note:
In our graph as the value of x approaches x=0 the graph starts getting very large on both sides of the line given by x=0. This line is called a vertical asymptote. Also, as x gets very large, both positive and negative, the graph approaches the line given by y=0. This line is called a horizontal asymptote.
Recently Updated Pages
Master Class 11 English: Engaging Questions & Answers for Success
Master Class 11 Social Science: Engaging Questions & Answers for Success
Master Class 11 Maths: Engaging Questions & Answers for Success
Master Class 11 Chemistry: Engaging Questions & Answers for Success
Master Class 11 Biology: Engaging Questions & Answers for Success
Master Class 11 Physics: Engaging Questions & Answers for Success
Trending doubts
One Metric ton is equal to kg A 10000 B 1000 C 100 class 11 physics CBSE
Difference Between Prokaryotic Cells and Eukaryotic Cells
Find the value of the expression given below sin 30circ class 11 maths CBSE
1 ton equals to A 100 kg B 1000 kg C 10 kg D 10000 class 11 physics CBSE
Two of the body parts which do not appear in MRI are class 11 biology CBSE
What are hard magnetic materials class 11 physics CBSE