


How do you graph \[r = 1 + 2\sin \theta \]?
Answer
581.4k+ views
Hint: In this question, first we have to graph the given function which is in polar coordinate form in terms of \[\left( {r,\theta } \right)\], where \[r\] is the distance of the point from the origin and \[\theta \] is the angle between the line joining origin and the point and positive axis. Now taking some values for \[\theta \] and finding the values of \[r\], now tabulate the values and plot the points on the graph we will get the required graph.
Complete step-by-step answer:
Polar coordinate pairs can have positive angles or negative angles for values of theta. In addition, they can have positive and negative radii. When graphing polar coordinates, though, the radius can be negative, which means that you move in the opposite direction of the angle from the pole.
Now given function is \[r = 1 + 2\sin \theta \],
Take different values for \[\theta \] and then we will get the values for \[r\], and then plot the points on the graph.
So first take \[\theta = 0\],
Now substitute the value in the given function \[r = 1 + 2\sin \theta \], we get,
\[ \Rightarrow r = 1 + 2\sin 0\],
Now simplifying we get,
\[ \Rightarrow r = 1 + 2(0)\],
Now again simplifying we get,
\[ \Rightarrow r = 1 + 0\],
Now adding to simplify further we get,
\[ \Rightarrow r = 1\],
Now take \[\theta = \dfrac{\pi }{4}\],
Now substitute the value in the given function \[r = 1 + 2\sin \theta \], we get,
\[ \Rightarrow r = 1 + 2\sin \left( {\dfrac{\pi }{4}} \right)\],
Now simplifying we get,
\[ \Rightarrow r = 1 + 2\left( {\dfrac{1}{{\sqrt 2 }}} \right)\],
Now again simplifying we get,
\[ \Rightarrow r = 1 + \sqrt 2 \],
Now further simplifying we get,
\[ \Rightarrow r = 1 + 1.414\],
Now adding to simplify further we get,
\[ \Rightarrow r = 2.414\],
Now take \[\theta = \dfrac{\pi }{2}\],
Now substitute the value in the given function \[r = 1 + 2\sin \theta \], we get,
\[ \Rightarrow r = 1 + 2\sin \left( {\dfrac{\pi }{2}} \right)\],
Now simplifying we get,
\[ \Rightarrow r = 1 + 2\left( 1 \right)\],
Now again simplifying we get,
\[ \Rightarrow r = 1 + 2\],
Now adding to simplify further we get,
\[ \Rightarrow r = 3\],
Now take \[\theta = \dfrac{{3\pi }}{4}\],
Now substitute the value in the given function \[r = 1 + 2\sin \theta \], we get,
\[ \Rightarrow r = 1 + 2\sin \left( {\dfrac{{3\pi }}{4}} \right)\],
Now simplifying we get,
\[ \Rightarrow r = 1 + 2\left( {0.707} \right)\],
Now again simplifying we get,
\[ \Rightarrow r = 1 + 1.414\],
Now adding to simplify further we get,
\[ \Rightarrow r = 2.414\],
Now take \[\theta = \pi \],
Now substitute the value in the given function \[r = 1 + 2\sin \theta \], we get,
\[ \Rightarrow r = 1 + 2\sin \left( \pi \right)\],
Now simplifying we get,
\[ \Rightarrow r = 1 + 2\left( 0 \right)\],
Now again simplifying we get,
\[ \Rightarrow r = 1 + 0\],
Now adding to simplify further we get,
\[ \Rightarrow r = 1\],
Now take \[\theta = \dfrac{{5\pi }}{4}\],
Now substitute the value in the given function \[r = 1 + 2\sin \theta \], we get,
\[ \Rightarrow r = 1 + 2\sin \left( {\dfrac{{5\pi }}{4}} \right)\],
Now simplifying we get,
\[ \Rightarrow r = 1 + 2\left( { - 0.707} \right)\],
Now again simplifying we get,
\[ \Rightarrow r = 1 - 1.414\],
Now adding to simplify further we get,
\[ \Rightarrow r = - 0.414\],
Now take\[\theta = \dfrac{{3\pi }}{2}\],
Now substitute the value in the given function \[r = 1 + 2\sin \theta \], we get,
\[ \Rightarrow r = 1 + 2\sin \left( {\dfrac{{3\pi }}{2}} \right)\],
Now simplifying we get,
\[ \Rightarrow r = 1 + 2\left( { - 1} \right)\],
Now again simplifying we get,
\[ \Rightarrow r = 1 - 2\],
Now adding to simplify further we get,
\[ \Rightarrow r = - 1\],
Now take \[\theta = \dfrac{{7\pi }}{4}\],
Now substitute the value in the given function\[r = 1 + 2\sin \theta \], we get,
\[ \Rightarrow r = 1 + 2\sin \left( {\dfrac{{7\pi }}{4}} \right)\],
Now simplifying we get,
\[ \Rightarrow r = 1 + 2\left( { - 0.707} \right)\],
Now again simplifying we get,
\[ \Rightarrow r = 1 - 1.414\],
Now adding to simplify further we get,
\[ \Rightarrow r = - 0.414\],
Now take \[\theta = 2\pi \],
Now substitute the value in the given function \[r = 1 + 2\sin \theta \], we get,
\[ \Rightarrow r = 1 + 2\sin \left( {2\pi } \right)\],
Now simplifying we get,
\[ \Rightarrow r = 1 + 2\left( 0 \right)\],
Now again simplifying we get,
\[ \Rightarrow r = 1 + 0\],
Now adding to simplify further we get,
\[ \Rightarrow r = 1\],
Now tabulating the values we get,
Now plotting the graphs we get,
The plane appears this way because the polar coordinates are a given radius and a given angle in standard position from the pole. Each circle represents one radius unit, and each line represents the special angles from the unit circle.
\[\therefore \]The required graph for the function \[r = 1 + 2\sin \theta \] is,

Note:
Polar coordinates are based on angles, unlike Cartesian coordinates, polar coordinates have many different ordered pairs. Because infinitely many values of theta have the same angle in standard position, an infinite number of coordinate pairs describe the same point. Also, a positive and a negative coterminal angle can describe the same point for the same radius, and because the radius can be either positive or negative, you can express the point with polar coordinates in many ways.
Complete step-by-step answer:
Polar coordinate pairs can have positive angles or negative angles for values of theta. In addition, they can have positive and negative radii. When graphing polar coordinates, though, the radius can be negative, which means that you move in the opposite direction of the angle from the pole.
Now given function is \[r = 1 + 2\sin \theta \],
Take different values for \[\theta \] and then we will get the values for \[r\], and then plot the points on the graph.
So first take \[\theta = 0\],
Now substitute the value in the given function \[r = 1 + 2\sin \theta \], we get,
\[ \Rightarrow r = 1 + 2\sin 0\],
Now simplifying we get,
\[ \Rightarrow r = 1 + 2(0)\],
Now again simplifying we get,
\[ \Rightarrow r = 1 + 0\],
Now adding to simplify further we get,
\[ \Rightarrow r = 1\],
Now take \[\theta = \dfrac{\pi }{4}\],
Now substitute the value in the given function \[r = 1 + 2\sin \theta \], we get,
\[ \Rightarrow r = 1 + 2\sin \left( {\dfrac{\pi }{4}} \right)\],
Now simplifying we get,
\[ \Rightarrow r = 1 + 2\left( {\dfrac{1}{{\sqrt 2 }}} \right)\],
Now again simplifying we get,
\[ \Rightarrow r = 1 + \sqrt 2 \],
Now further simplifying we get,
\[ \Rightarrow r = 1 + 1.414\],
Now adding to simplify further we get,
\[ \Rightarrow r = 2.414\],
Now take \[\theta = \dfrac{\pi }{2}\],
Now substitute the value in the given function \[r = 1 + 2\sin \theta \], we get,
\[ \Rightarrow r = 1 + 2\sin \left( {\dfrac{\pi }{2}} \right)\],
Now simplifying we get,
\[ \Rightarrow r = 1 + 2\left( 1 \right)\],
Now again simplifying we get,
\[ \Rightarrow r = 1 + 2\],
Now adding to simplify further we get,
\[ \Rightarrow r = 3\],
Now take \[\theta = \dfrac{{3\pi }}{4}\],
Now substitute the value in the given function \[r = 1 + 2\sin \theta \], we get,
\[ \Rightarrow r = 1 + 2\sin \left( {\dfrac{{3\pi }}{4}} \right)\],
Now simplifying we get,
\[ \Rightarrow r = 1 + 2\left( {0.707} \right)\],
Now again simplifying we get,
\[ \Rightarrow r = 1 + 1.414\],
Now adding to simplify further we get,
\[ \Rightarrow r = 2.414\],
Now take \[\theta = \pi \],
Now substitute the value in the given function \[r = 1 + 2\sin \theta \], we get,
\[ \Rightarrow r = 1 + 2\sin \left( \pi \right)\],
Now simplifying we get,
\[ \Rightarrow r = 1 + 2\left( 0 \right)\],
Now again simplifying we get,
\[ \Rightarrow r = 1 + 0\],
Now adding to simplify further we get,
\[ \Rightarrow r = 1\],
Now take \[\theta = \dfrac{{5\pi }}{4}\],
Now substitute the value in the given function \[r = 1 + 2\sin \theta \], we get,
\[ \Rightarrow r = 1 + 2\sin \left( {\dfrac{{5\pi }}{4}} \right)\],
Now simplifying we get,
\[ \Rightarrow r = 1 + 2\left( { - 0.707} \right)\],
Now again simplifying we get,
\[ \Rightarrow r = 1 - 1.414\],
Now adding to simplify further we get,
\[ \Rightarrow r = - 0.414\],
Now take\[\theta = \dfrac{{3\pi }}{2}\],
Now substitute the value in the given function \[r = 1 + 2\sin \theta \], we get,
\[ \Rightarrow r = 1 + 2\sin \left( {\dfrac{{3\pi }}{2}} \right)\],
Now simplifying we get,
\[ \Rightarrow r = 1 + 2\left( { - 1} \right)\],
Now again simplifying we get,
\[ \Rightarrow r = 1 - 2\],
Now adding to simplify further we get,
\[ \Rightarrow r = - 1\],
Now take \[\theta = \dfrac{{7\pi }}{4}\],
Now substitute the value in the given function\[r = 1 + 2\sin \theta \], we get,
\[ \Rightarrow r = 1 + 2\sin \left( {\dfrac{{7\pi }}{4}} \right)\],
Now simplifying we get,
\[ \Rightarrow r = 1 + 2\left( { - 0.707} \right)\],
Now again simplifying we get,
\[ \Rightarrow r = 1 - 1.414\],
Now adding to simplify further we get,
\[ \Rightarrow r = - 0.414\],
Now take \[\theta = 2\pi \],
Now substitute the value in the given function \[r = 1 + 2\sin \theta \], we get,
\[ \Rightarrow r = 1 + 2\sin \left( {2\pi } \right)\],
Now simplifying we get,
\[ \Rightarrow r = 1 + 2\left( 0 \right)\],
Now again simplifying we get,
\[ \Rightarrow r = 1 + 0\],
Now adding to simplify further we get,
\[ \Rightarrow r = 1\],
Now tabulating the values we get,
| \[\theta \] | \[r\] |
| 0 | 1 |
| \[\dfrac{\pi }{4}\] | 2.414 |
| \[\dfrac{\pi }{2}\] | 3 |
| \[\dfrac{{3\pi }}{4}\] | 2.414 |
| \[\pi \] | 1 |
| \[\dfrac{{5\pi }}{4}\] | -0.414 |
| \[\dfrac{{3\pi }}{2}\] | -1 |
| \[\dfrac{{7\pi }}{4}\] | -0.414 |
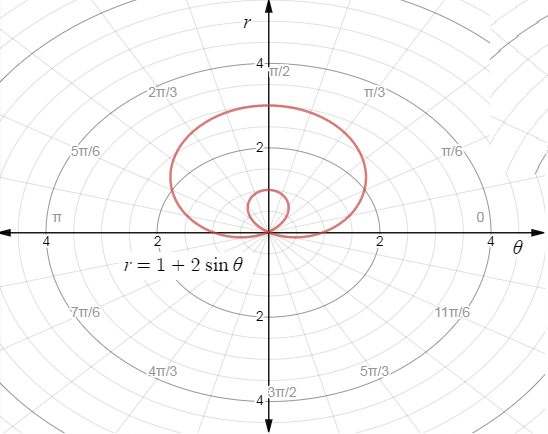
| \[2\pi \] | 1 |
Now plotting the graphs we get,
The plane appears this way because the polar coordinates are a given radius and a given angle in standard position from the pole. Each circle represents one radius unit, and each line represents the special angles from the unit circle.
\[\therefore \]The required graph for the function \[r = 1 + 2\sin \theta \] is,
Note:
Polar coordinates are based on angles, unlike Cartesian coordinates, polar coordinates have many different ordered pairs. Because infinitely many values of theta have the same angle in standard position, an infinite number of coordinate pairs describe the same point. Also, a positive and a negative coterminal angle can describe the same point for the same radius, and because the radius can be either positive or negative, you can express the point with polar coordinates in many ways.
Recently Updated Pages
Master Class 12 Business Studies: Engaging Questions & Answers for Success
Master Class 12 Chemistry: Engaging Questions & Answers for Success
Master Class 12 Biology: Engaging Questions & Answers for Success
Class 12 Question and Answer - Your Ultimate Solutions Guide
Master Class 11 English: Engaging Questions & Answers for Success
Master Class 11 Maths: Engaging Questions & Answers for Success
Trending doubts
Which is more stable and why class 12 chemistry CBSE
Which are the Top 10 Largest Countries of the World?
Draw a labelled sketch of the human eye class 12 physics CBSE
Differentiate between homogeneous and heterogeneous class 12 chemistry CBSE
What are the major means of transport Explain each class 12 social science CBSE
Sulphuric acid is known as the king of acids State class 12 chemistry CBSE