


How do you graph \[\ln \left( -x \right)\]?
Answer
572.1k+ views
Hint:
In the given question, we have been asked to plot the graph of a given logarithmic function. We need to graph the given logarithmic function using vertical asymptote and for that we need to set-up the given arguments equals to zero i.e. x = 0 and thus, the vertical asymptote occurs at x equals to zero.
Complete step by step solution:
We have given that,
\[\ln \left( -x \right)\]
Le the function \[y=\ln \left( -x \right)\]
Set up the given function of the logarithm equals to 0.
\[x=0\]
Thus,
The vertical asymptote occurs at x = 0.
Therefore, vertical asymptote: x = 0.
Now,
As we know that logarithmic functions are only defined at the positive values i.e. where the value of ‘x’ is greater than zero.
Therefore, for the given logarithmic function is only defined at the values which are less than zero i.e.,
x < 0.
Finding the points:
At x = -1
\[y=\ln \left( -x \right)\Rightarrow y=\ln \left( -\left( -1 \right) \right)\Rightarrow y=\ln \left( 1 \right)=0\]
At x = -2
\[y=\ln \left( -x \right)\Rightarrow y=\ln \left( -\left( -2 \right) \right)\Rightarrow y=\ln \left( 2 \right)=0.69\]
At x = -3
\[y=\ln \left( -x \right)\Rightarrow y=\ln \left( -\left( -3 \right) \right)\Rightarrow y=\ln \left( 3 \right)=1.099\]
We got points to plot on the graph, i.e.
Thus, graph of the given function;
Hence, this is the required graph of\[\ln \left( -x \right)\].
Note:
While plotting the graph of the logarithmic function, students need to remember that logarithmic functions are only defined at the positive values i.e. where the value of ‘x’ is greater than zero. Therefore, for the given logarithmic function is only defined at the values which are less than zero i.e.,
x < 0. Students need to be aware of the concepts of logarithm and exponent to avoid making errors.
In the given question, we have been asked to plot the graph of a given logarithmic function. We need to graph the given logarithmic function using vertical asymptote and for that we need to set-up the given arguments equals to zero i.e. x = 0 and thus, the vertical asymptote occurs at x equals to zero.
Complete step by step solution:
We have given that,
\[\ln \left( -x \right)\]
Le the function \[y=\ln \left( -x \right)\]
Set up the given function of the logarithm equals to 0.
\[x=0\]
Thus,
The vertical asymptote occurs at x = 0.
Therefore, vertical asymptote: x = 0.
Now,
As we know that logarithmic functions are only defined at the positive values i.e. where the value of ‘x’ is greater than zero.
Therefore, for the given logarithmic function is only defined at the values which are less than zero i.e.,
x < 0.
Finding the points:
At x = -1
\[y=\ln \left( -x \right)\Rightarrow y=\ln \left( -\left( -1 \right) \right)\Rightarrow y=\ln \left( 1 \right)=0\]
At x = -2
\[y=\ln \left( -x \right)\Rightarrow y=\ln \left( -\left( -2 \right) \right)\Rightarrow y=\ln \left( 2 \right)=0.69\]
At x = -3
\[y=\ln \left( -x \right)\Rightarrow y=\ln \left( -\left( -3 \right) \right)\Rightarrow y=\ln \left( 3 \right)=1.099\]
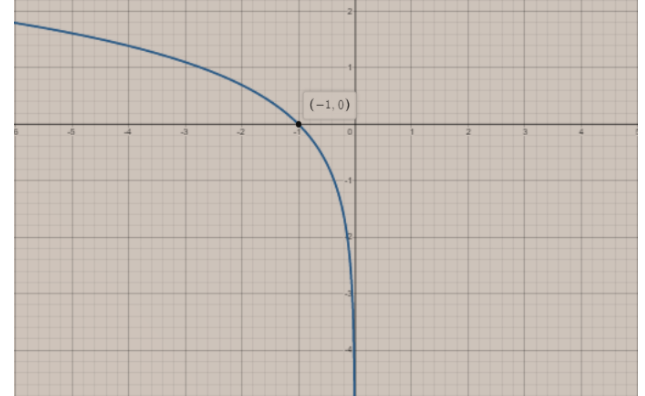
We got points to plot on the graph, i.e.
| x | Y |
| -1 | 0 |
| -2 | 0.69 |
| -3 | 1.099 |
Thus, graph of the given function;
Hence, this is the required graph of\[\ln \left( -x \right)\].
Note:
While plotting the graph of the logarithmic function, students need to remember that logarithmic functions are only defined at the positive values i.e. where the value of ‘x’ is greater than zero. Therefore, for the given logarithmic function is only defined at the values which are less than zero i.e.,
x < 0. Students need to be aware of the concepts of logarithm and exponent to avoid making errors.
Recently Updated Pages
Master Class 11 Social Science: Engaging Questions & Answers for Success
Master Class 11 English: Engaging Questions & Answers for Success
Master Class 11 Maths: Engaging Questions & Answers for Success
Master Class 11 Chemistry: Engaging Questions & Answers for Success
Master Class 11 Biology: Engaging Questions & Answers for Success
Master Class 11 Physics: Engaging Questions & Answers for Success
Trending doubts
One Metric ton is equal to kg A 10000 B 1000 C 100 class 11 physics CBSE
Difference Between Prokaryotic Cells and Eukaryotic Cells
How many of the following diseases can be studied with class 11 biology CBSE
Which of the following enzymes is used for carboxylation class 11 biology CBSE
Draw a diagram of a plant cell and label at least eight class 11 biology CBSE
Two of the body parts which do not appear in MRI are class 11 biology CBSE