


How do you graph linear function\[?\]
Answer
590.7k+ views
Hint:The form of linear function is given as $y=f(x)=ax+b $. And it always gives a straight line in the graph. The degree of its function will be almost $1$ or$0$. The linear function has one independent and one dependent variable in the above linear function $y$ is a dependent variable that depends on the value of $x$ and the independent variable is $x$. Here $a$ is coefficient of $x$ and $b$ is constant.
Complete step by step solution:
Graphing a linear function we will take one example
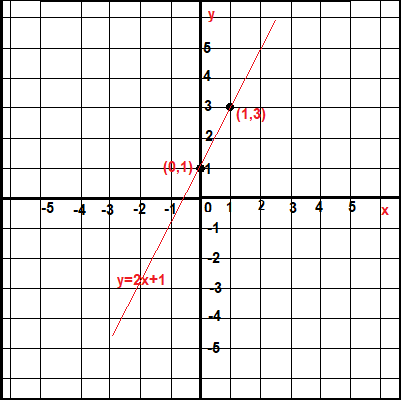
Let us consider a linear equation is $y=2x+1$.
Here $y$ is the dependent variable and $x$ is an independent variable.
For plotting this linear equation in the graph we need to find two points that satisfy the equation $y=2x+1$.
Now we assume that
If $x=0$ then,
$\Rightarrow y=2\times 0+1$
$\Rightarrow y=0+1=1$
$\Rightarrow y=1$
Here one point is $(x=0,y=1)$
Again we assume another value of $x$
If $x=1$then,
$\Rightarrow y=2\times 1+1$
$\Rightarrow y=2+1$
$\Rightarrow y=3$
Here another point will be $(x=1,y=3)$
Now we will plot the these point $(0,1)$ and $(1,3)$ in graph
After plotting these points as in the given graph join these points we will get a straight line.
The form of linear function is given as $y=f(x)=ax+b $. And it always gives a straight line in the graph. The degree of its function will be almost $1$ or $0$. The linear function has one independent and one dependent variable in the above linear function $y$ is a dependent variable that depends on the value of $x$ and the independent variable is $x$. Here $a$ is coefficient of $x$ and $b$ is constant.
Notes: Every point $(a,b)$ of straight line $y=mx+c$ give the solutions $x=a$ and $y=b$. Each point will satisfy the linear equation.
The linear equation has infinitely many solutions if the linear equation has two variables.
If the linear equation is $y=mx$, then it passes through origin$(0,0)$.
Complete step by step solution:
Graphing a linear function we will take one example
Let us consider a linear equation is $y=2x+1$.
Here $y$ is the dependent variable and $x$ is an independent variable.
For plotting this linear equation in the graph we need to find two points that satisfy the equation $y=2x+1$.
Now we assume that
If $x=0$ then,
$\Rightarrow y=2\times 0+1$
$\Rightarrow y=0+1=1$
$\Rightarrow y=1$
Here one point is $(x=0,y=1)$
Again we assume another value of $x$
If $x=1$then,
$\Rightarrow y=2\times 1+1$
$\Rightarrow y=2+1$
$\Rightarrow y=3$
Here another point will be $(x=1,y=3)$
Now we will plot the these point $(0,1)$ and $(1,3)$ in graph
After plotting these points as in the given graph join these points we will get a straight line.
The form of linear function is given as $y=f(x)=ax+b $. And it always gives a straight line in the graph. The degree of its function will be almost $1$ or $0$. The linear function has one independent and one dependent variable in the above linear function $y$ is a dependent variable that depends on the value of $x$ and the independent variable is $x$. Here $a$ is coefficient of $x$ and $b$ is constant.
Notes: Every point $(a,b)$ of straight line $y=mx+c$ give the solutions $x=a$ and $y=b$. Each point will satisfy the linear equation.
The linear equation has infinitely many solutions if the linear equation has two variables.
If the linear equation is $y=mx$, then it passes through origin$(0,0)$.
Recently Updated Pages
Master Class 12 Economics: Engaging Questions & Answers for Success
Master Class 12 English: Engaging Questions & Answers for Success
Master Class 12 Social Science: Engaging Questions & Answers for Success
Master Class 12 Maths: Engaging Questions & Answers for Success
Master Class 12 Physics: Engaging Questions & Answers for Success
Master Class 9 General Knowledge: Engaging Questions & Answers for Success
Trending doubts
Explain the Treaty of Vienna of 1815 class 10 social science CBSE
Why is it 530 pm in india when it is 1200 afternoon class 10 social science CBSE
What is the full form of POSCO class 10 social science CBSE
Define Potential, Developed, Stock and Reserved resources
The speaker of the Lok Sabha is elected by the APresident class 10 social science CBSE
Complete the sentence with the most appropriate word class 10 english CBSE