


How do you graph $f(x) = 3{x^2} + x - 5$?
Answer
547.2k+ views
Hint: According to the question given in the question we have to determine the graph for the$f(x) = 3{x^2} + x - 5$. So, to determine the graph for the given quadratic expression we have to substitute the different values of x which will be integers can be negative or positive to obtain the different values of y for the different values of x.
Now, we have to substitute the value of x as -6 in the given function or we can say the quadratic equation to obtain the value of y so that we can achieve the points to plot in the graph.
Now, we have to substitute the value of x as -4 in the given function or we can say the quadratic equation to obtain the value of y so that we can achieve the points to plot in the graph.
Now, we have to substitute the value of x as -2 in the given function or we can say the quadratic equation to obtain the value of y so that we can achieve the points to plot in the graph.
Now, we have to substitute the value of x as 0 in the given function or we can say the quadratic equation to obtain the value of y so that we can achieve the points to plot in the graph.
Now, we have to substitute the value of x as 2 in the given function or we can say the quadratic equation to obtain the value of y so that we can achieve the points to plot in the graph.
Now, we have to substitute the value of x as 4 in the given function or we can say the quadratic equation to obtain the value of y so that we can achieve the points to plot in the graph.
Now, we have to substitute the value of x as 6 in the given function or we can say the quadratic equation to obtain the value of y so that we can achieve the points to plot in the graph.
Now, with the help of all the points obtained just above, we can determine the graph for the given expression.
Complete step by step solution:
Step 1: First of all we have to substitute the value of x as -6 in the given function or we can say the quadratic equation to obtain the value of y so that we can achieve the points to plot in the graph. Hence,
$
\Rightarrow y = 3{( - 6)^2} + ( - 6) - 5 \\
\Rightarrow y = 108 - 11 \\
\Rightarrow y = 97 \\
$
Step 2: Now, we have to substitute the value of x as -4 in the given function or we can say the quadratic equation to obtain the value of y so that we can achieve the points to plot in the graph.
$
\Rightarrow y = 3{( - 4)^2} + ( - 4) - 5 \\
\Rightarrow y = 48 - 9 \\
\Rightarrow y = 39 \\
$
Step 3: Now, we have to substitute the value of x as 0 in the given function or we can say the quadratic equation to obtain the value of y so that we can achieve the points to plot in the graph.
$
\Rightarrow y = 3{(0)^2} + (0) - 5 \\
\Rightarrow y = - 5 \\
\Rightarrow y = - 5 \\
$
Step 4: Now, we have to substitute the value of x as 2 in the given function or we can say the quadratic equation to obtain the value of y so that we can achieve the points to plot in the graph.
$
\Rightarrow y = 3{(2)^2} + (2) - 5 \\
\Rightarrow y = 12 - 3 \\
\Rightarrow y = 9 \\
$
Step 5: Now, we have to substitute the value of x as 4 in the given function or we can say the quadratic equation to obtain the value of y so that we can achieve the points to plot in the graph.
$
\Rightarrow y = 3{(4)^2} + (4) - 5 \\
\Rightarrow y = 48 - 1 \\
\Rightarrow y = 47 \\
$
Step 6: Now, we have to substitute the value of x as 6 in the given function or we can say the quadratic equation to obtain the value of y so that we can achieve the points to plot in the graph.
$
\Rightarrow y = 3{(6)^2} + (6) - 5 \\
\Rightarrow y = 108 + 1 \\
\Rightarrow y = 109 \\
$
Step 7: Now, with the help of all the points we can draw a table so that we can easily draw the graph for the given expression. Hence,
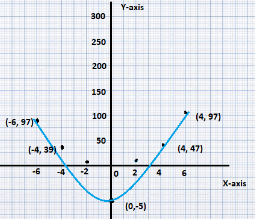
Now, with the help of the table above we can easily draw the graph for the given expression which is as drawn below.
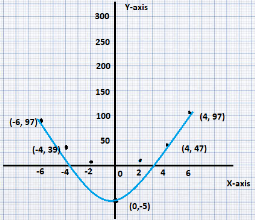
Final solution: Hence, with the help of the points we have determined the graph for the given expression which is as below.
Note:
1. It is necessary that we have to substitute the different values of y as an integer which can be positive and negative both to determine the different values of y to obtain the points to plot in the graph.
2. To plot the point in the graph we have to take the points in the x-axis and y-axis on the quadrant plane so that we can draw the curve.
Now, we have to substitute the value of x as -6 in the given function or we can say the quadratic equation to obtain the value of y so that we can achieve the points to plot in the graph.
Now, we have to substitute the value of x as -4 in the given function or we can say the quadratic equation to obtain the value of y so that we can achieve the points to plot in the graph.
Now, we have to substitute the value of x as -2 in the given function or we can say the quadratic equation to obtain the value of y so that we can achieve the points to plot in the graph.
Now, we have to substitute the value of x as 0 in the given function or we can say the quadratic equation to obtain the value of y so that we can achieve the points to plot in the graph.
Now, we have to substitute the value of x as 2 in the given function or we can say the quadratic equation to obtain the value of y so that we can achieve the points to plot in the graph.
Now, we have to substitute the value of x as 4 in the given function or we can say the quadratic equation to obtain the value of y so that we can achieve the points to plot in the graph.
Now, we have to substitute the value of x as 6 in the given function or we can say the quadratic equation to obtain the value of y so that we can achieve the points to plot in the graph.
Now, with the help of all the points obtained just above, we can determine the graph for the given expression.
Complete step by step solution:
Step 1: First of all we have to substitute the value of x as -6 in the given function or we can say the quadratic equation to obtain the value of y so that we can achieve the points to plot in the graph. Hence,
$
\Rightarrow y = 3{( - 6)^2} + ( - 6) - 5 \\
\Rightarrow y = 108 - 11 \\
\Rightarrow y = 97 \\
$
Step 2: Now, we have to substitute the value of x as -4 in the given function or we can say the quadratic equation to obtain the value of y so that we can achieve the points to plot in the graph.
$
\Rightarrow y = 3{( - 4)^2} + ( - 4) - 5 \\
\Rightarrow y = 48 - 9 \\
\Rightarrow y = 39 \\
$
Step 3: Now, we have to substitute the value of x as 0 in the given function or we can say the quadratic equation to obtain the value of y so that we can achieve the points to plot in the graph.
$
\Rightarrow y = 3{(0)^2} + (0) - 5 \\
\Rightarrow y = - 5 \\
\Rightarrow y = - 5 \\
$
Step 4: Now, we have to substitute the value of x as 2 in the given function or we can say the quadratic equation to obtain the value of y so that we can achieve the points to plot in the graph.
$
\Rightarrow y = 3{(2)^2} + (2) - 5 \\
\Rightarrow y = 12 - 3 \\
\Rightarrow y = 9 \\
$
Step 5: Now, we have to substitute the value of x as 4 in the given function or we can say the quadratic equation to obtain the value of y so that we can achieve the points to plot in the graph.
$
\Rightarrow y = 3{(4)^2} + (4) - 5 \\
\Rightarrow y = 48 - 1 \\
\Rightarrow y = 47 \\
$
Step 6: Now, we have to substitute the value of x as 6 in the given function or we can say the quadratic equation to obtain the value of y so that we can achieve the points to plot in the graph.
$
\Rightarrow y = 3{(6)^2} + (6) - 5 \\
\Rightarrow y = 108 + 1 \\
\Rightarrow y = 109 \\
$
Step 7: Now, with the help of all the points we can draw a table so that we can easily draw the graph for the given expression. Hence,
| x- value | $y = 3{x^2} + x - 5$ |
| -6 | 97 |
| -4 | 39 |
| -2 | 5 |
| 0 | -5 |
| 2 | 9 |
| 4 | 47 |
| 6 | 109 |
Now, with the help of the table above we can easily draw the graph for the given expression which is as drawn below.
Final solution: Hence, with the help of the points we have determined the graph for the given expression which is as below.
Note:
1. It is necessary that we have to substitute the different values of y as an integer which can be positive and negative both to determine the different values of y to obtain the points to plot in the graph.
2. To plot the point in the graph we have to take the points in the x-axis and y-axis on the quadrant plane so that we can draw the curve.
Recently Updated Pages
Master Class 10 Computer Science: Engaging Questions & Answers for Success
Master Class 10 English: Engaging Questions & Answers for Success
Master Class 10 Social Science: Engaging Questions & Answers for Success
Master Class 10 General Knowledge: Engaging Questions & Answers for Success
Master Class 10 Maths: Engaging Questions & Answers for Success
Master Class 10 Science: Engaging Questions & Answers for Success
Trending doubts
Why is there a time difference of about 5 hours between class 10 social science CBSE
The draft of the Preamble of the Indian Constitution class 10 social science CBSE
What is the median of the first 10 natural numbers class 10 maths CBSE
Who gave "Inqilab Zindabad" slogan?
Who was Subhash Chandra Bose Why was he called Net class 10 english CBSE
Write a letter to the principal requesting him to grant class 10 english CBSE