


How do you graph Boyle’s law?
Answer
589.8k+ views
Hint Boyle’s law studies the relationship between the pressure and volume of a gas at constant temperature. That is why the graph for Boyle’s is called an isotherm. The volume of the gas is going to represent with V and pressure is going to represent with P.
Complete answer:
- In the question it is asked to draw the graph for Boyle’s law.
- Boyle’s law states that the pressure is a certain amount if gas is inversely proportional to volume of the gas at constant temperature.
- We know that as the pressure of the gas increases then the volume of the gas decreases.
- Means
$P\propto \frac{1}{V}$
Here P = pressure of the gas and V = volume of the gas at constant temperature.
- If we are going to draw a graph by taking pressure of the gas ‘P’ on x- axis and volume of the gas ‘V’ on y- axis for a given mass of the gas at constant temperature we will get the following graph
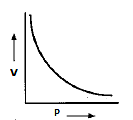
- The graph depicts that as the pressure on the gas increases then the volume of the gas decreases automatically.
- The above graph is also called isotherm due to constant temperature.
Note: If we are going to draw a graph by taking V against 1/P for a given amount of gas then we will get a straight line because pressure of the gas and volume of the gas are inversely proportional to each other.
Complete answer:
- In the question it is asked to draw the graph for Boyle’s law.
- Boyle’s law states that the pressure is a certain amount if gas is inversely proportional to volume of the gas at constant temperature.
- We know that as the pressure of the gas increases then the volume of the gas decreases.
- Means
$P\propto \frac{1}{V}$
Here P = pressure of the gas and V = volume of the gas at constant temperature.
- If we are going to draw a graph by taking pressure of the gas ‘P’ on x- axis and volume of the gas ‘V’ on y- axis for a given mass of the gas at constant temperature we will get the following graph
- The graph depicts that as the pressure on the gas increases then the volume of the gas decreases automatically.
- The above graph is also called isotherm due to constant temperature.
Note: If we are going to draw a graph by taking V against 1/P for a given amount of gas then we will get a straight line because pressure of the gas and volume of the gas are inversely proportional to each other.
Recently Updated Pages
Master Class 11 Social Science: Engaging Questions & Answers for Success
Master Class 11 English: Engaging Questions & Answers for Success
Master Class 11 Maths: Engaging Questions & Answers for Success
Master Class 11 Chemistry: Engaging Questions & Answers for Success
Master Class 11 Biology: Engaging Questions & Answers for Success
Master Class 11 Physics: Engaging Questions & Answers for Success
Trending doubts
Differentiate between an exothermic and an endothermic class 11 chemistry CBSE
One Metric ton is equal to kg A 10000 B 1000 C 100 class 11 physics CBSE
Difference Between Prokaryotic Cells and Eukaryotic Cells
There are 720 permutations of the digits 1 2 3 4 5 class 11 maths CBSE
Two of the body parts which do not appear in MRI are class 11 biology CBSE
Which gas is abundant in air class 11 chemistry CBSE