


How do you graph an inequality \[x < 3?\]
Answer
501k+ views
Hint: Understand the given inequality. Draw the graph of \[x = 3\] which is parallel to \[y\] the axis. \[( - \infty ,3)\] In this graph, the points are less than \[x\] the axis. Shade the left side of \[x = 3\] which is the region we require. Since the given question is \[x < 3\] , $x = 3$ is not included in the shaded region. Finally, get a graph of inequality.
Complete answer:
In the given question, we find the graph of the straight line and given by the equation is \[x < 3\] . Inequality \[x < 3\] is not included in the value \[3\]
In the line \[x < 3\] it goes vertical and parallel to the \[y\] axis.
The line \[x < 3\] meets the \[x\] axis at the point \[\left( { - \infty ,3} \right)\].
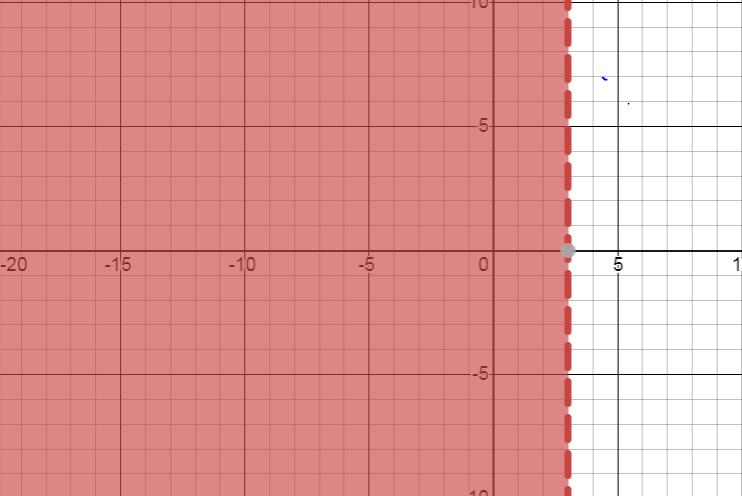
The line \[x < 3\] will be dashed because the inequality does not include the value line \[x = 3\] .
In the inequality \[x < 3\] says we find to consider the values which are less than \[3\]. So, we shade the left and side values of \[x = 3\] but that shade does not include the \[x = 3\] line.
And one more that we will not consider the right-side graph of the inequality \[x < 3\]. This means we haven’t to shade the part to the right side of \[x = 3\] Finally the graph of inequality \[x < 3\] given below
Note: A set hasn't lower bound and upper bound. That set is called an unbounded set. The problem is also unbounded. The inequality symbol is used to compare the given two values. In the given problem, we have to shade that region. where the \[3\] value is lesser than \[3\] though which we can identify the values that are lesser than \[3\] the shaded region contains those points of the form \[(x,y)\] where \[x < 3\] the shaded region is unbounded.
Complete answer:
In the given question, we find the graph of the straight line and given by the equation is \[x < 3\] . Inequality \[x < 3\] is not included in the value \[3\]
In the line \[x < 3\] it goes vertical and parallel to the \[y\] axis.
The line \[x < 3\] meets the \[x\] axis at the point \[\left( { - \infty ,3} \right)\].
The line \[x < 3\] will be dashed because the inequality does not include the value line \[x = 3\] .
In the inequality \[x < 3\] says we find to consider the values which are less than \[3\]. So, we shade the left and side values of \[x = 3\] but that shade does not include the \[x = 3\] line.
And one more that we will not consider the right-side graph of the inequality \[x < 3\]. This means we haven’t to shade the part to the right side of \[x = 3\] Finally the graph of inequality \[x < 3\] given below
Note: A set hasn't lower bound and upper bound. That set is called an unbounded set. The problem is also unbounded. The inequality symbol is used to compare the given two values. In the given problem, we have to shade that region. where the \[3\] value is lesser than \[3\] though which we can identify the values that are lesser than \[3\] the shaded region contains those points of the form \[(x,y)\] where \[x < 3\] the shaded region is unbounded.

Recently Updated Pages
Master Class 11 English: Engaging Questions & Answers for Success
Master Class 11 Maths: Engaging Questions & Answers for Success
Class 11 Question and Answer - Your Ultimate Solutions Guide
Master Class 11 Biology: Engaging Questions & Answers for Success
Master Class 11 Physics: Engaging Questions & Answers for Success
Master Class 11 Accountancy: Engaging Questions & Answers for Success
Trending doubts
Find the sum of series 1 + 2 + 3 + 4 + 5 + + 100 class 9 maths CBSE
Fill the blanks with the suitable prepositions 1 The class 9 english CBSE
Difference Between Plant Cell and Animal Cell
How many hours before the closure of election must class 9 social science CBSE
What is the Full Form of ICSE / ISC ?
What is pollution? How many types of pollution? Define it