


How do you graph $ 4x + y = 0? $
Answer
555k+ views
Hint: Linear equation in two variables always represents a straight line, in the given equation, the constant part is equal to zero that means the straight line of the given equation will pass through the origin and hence has one of the coordinates of its points. Find some more values of the point lying on the line of the given equation by putting random values of one variable in the equation then plot the points and finally join and extend the produced line segment in order to get the required graph.
Complete step-by-step answer:
To plot the graph of the equation $ 4x + y = 0 $ we will first find some set of coordinates of points that are satisfying the given equation by putting random values of $ x $ and get the values of $ y $ as follows
$
\Rightarrow 4x + y = 0 \\
\Rightarrow y = - 4x \;
$
Making a table of values to get the coordinates
Now plotting these points on a graph, we will get
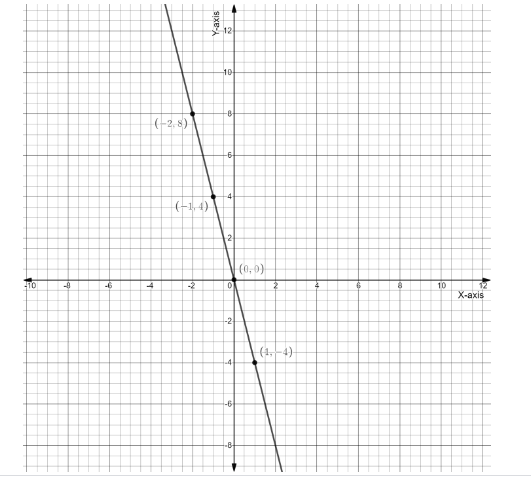
This is the required graph of the equation $ 4x + y = 0 $
Note: If a one degree two variable linear equation have a constant other than zero in its equation then use the intercept method to plot the graph, simply find the $ x\;{\text{and}}\;y $ intercepts and plot them directly on the graph paper.
Complete step-by-step answer:
To plot the graph of the equation $ 4x + y = 0 $ we will first find some set of coordinates of points that are satisfying the given equation by putting random values of $ x $ and get the values of $ y $ as follows
$
\Rightarrow 4x + y = 0 \\
\Rightarrow y = - 4x \;
$
Making a table of values to get the coordinates
| $ x $ | $ y = - 4x $ | Coordinate of the points $ (x,\;y) $ |
| 0 | 0 | (0, 0) |
| 1 | -4 | (1, -4) |
| -1 | 4 | (-1, 4) |
| -2 | 8 | (-2, 8) |
Now plotting these points on a graph, we will get
This is the required graph of the equation $ 4x + y = 0 $
Note: If a one degree two variable linear equation have a constant other than zero in its equation then use the intercept method to plot the graph, simply find the $ x\;{\text{and}}\;y $ intercepts and plot them directly on the graph paper.
Recently Updated Pages
Master Class 9 General Knowledge: Engaging Questions & Answers for Success
Master Class 9 Social Science: Engaging Questions & Answers for Success
Master Class 9 English: Engaging Questions & Answers for Success
Master Class 9 Maths: Engaging Questions & Answers for Success
Master Class 9 Science: Engaging Questions & Answers for Success
Class 9 Question and Answer - Your Ultimate Solutions Guide
Trending doubts
Difference Between Plant Cell and Animal Cell
Fill the blanks with the suitable prepositions 1 The class 9 english CBSE
Who is eligible for RTE class 9 social science CBSE
Which places in India experience sunrise first and class 9 social science CBSE
What is pollution? How many types of pollution? Define it
Name 10 Living and Non living things class 9 biology CBSE