


How do you graph \[4x + 3y - 12 = 0\]?
Answer
591k+ views
Hint: In this question we have to draw the linear equation given, for this we have to first find the intercepts we have to assume one variable as zero to find the value of other variable i.e., if we have to find \[x\]-intercept we have to put \[y = 0\], and if we have to find \[y\]-intercept we have to put \[x = 0\], and then plot the intercepts on the graph to get the required graph.
Complete step-by-step solution:
Now the given equation is \[4x + 3y - 12 = 0\],
First transform the equation in terms of \[y\], first take all terms except \[y\] to the right hand side then the equation becomes,
\[ \Rightarrow 3y = 12 - 4x\],
Now divide both sides by 3, we get,
\[ \Rightarrow \dfrac{{3y}}{3} = \dfrac{{12 - 4x}}{3}\],
Now simplifying we get,
\[ \Rightarrow y = \dfrac{{12}}{3} - \dfrac{{4x}}{3}\],
Now further simplification we get,
\[ \Rightarrow y = 4 - \dfrac{{4x}}{3}\],
Now we will assume \[x = 0\] to find the \[y\]-intercept, substituting the value of \[x\] in the equation we get,
\[ \Rightarrow y = \dfrac{{ - 4}}{3}\left( 0 \right) + 4\],
Now simplifying we get,
\[ \Rightarrow y = 4\],
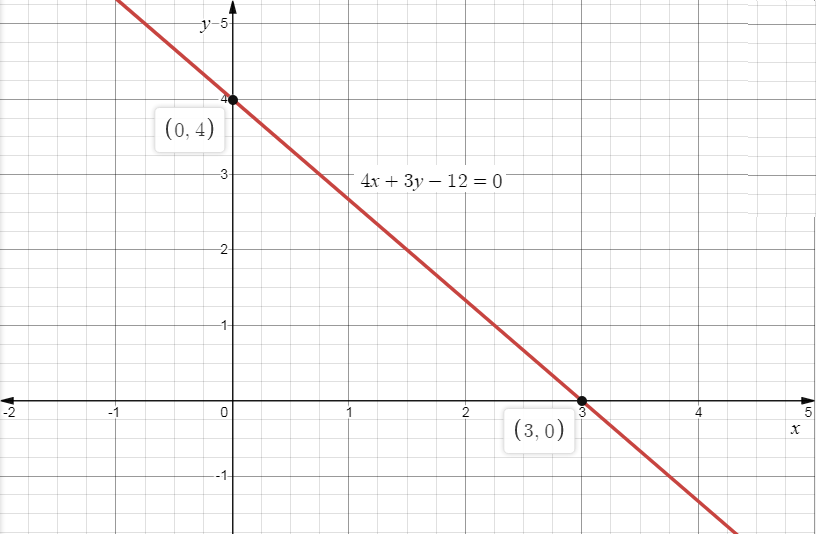
So, the \[y\]-intercept will be \[\left( {0,4} \right)\],
Now assume \[y = 0\] to find the \[x\]-intercept, substituting the value of \[y\] in the equation we get,
\[ \Rightarrow 0 = \dfrac{{ - 4}}{3}x + 4\],
Now subtracting 4 on both sides we get,
\[ \Rightarrow 0 - 4 = \dfrac{{ - 4}}{3}x + 4 - 4\],
Now eliminating the like terms we get,
\[ \Rightarrow - 4 = \dfrac{{ - 4}}{3}x\],
Now simplifying we get,
\[ \Rightarrow \dfrac{1}{3}x = 1\],
Now multiplying 3 on both sides, we get,
\[ \Rightarrow \dfrac{1}{3}x \times 3 = 1 \times 3\],
Now further simplification we get,
\[ \Rightarrow x = 3\],
So, \[x\]-intercept will be \[\left( {3,0} \right)\].
Plotting the points on the graph we get,
Note: A linear graph is a single straight line, to draw a linear graph, we need to locate some points on the graph, join these points if the line joining these points is a straight line, then the graph is a linear graph.
We can plot the linear graph by 3 methods, they are:
Plotting points: Assuming the values for \[x\] and find the corresponding value of \[y\], plot the points on the graph.
X- and Y- intercepts: If we have to find \[x\]-intercept we have to put \[y = 0\], and if we have to find \[y\]-intercept we have to put \[x = 0\], now plot the points on the graph.
Slope-intercept form: Plot the point after finding the \[y\]-intercept, now use the slope and find another point and plot the point using \[y\]-intercept, by joining the points we will get the straight line.
Complete step-by-step solution:
Now the given equation is \[4x + 3y - 12 = 0\],
First transform the equation in terms of \[y\], first take all terms except \[y\] to the right hand side then the equation becomes,
\[ \Rightarrow 3y = 12 - 4x\],
Now divide both sides by 3, we get,
\[ \Rightarrow \dfrac{{3y}}{3} = \dfrac{{12 - 4x}}{3}\],
Now simplifying we get,
\[ \Rightarrow y = \dfrac{{12}}{3} - \dfrac{{4x}}{3}\],
Now further simplification we get,
\[ \Rightarrow y = 4 - \dfrac{{4x}}{3}\],
Now we will assume \[x = 0\] to find the \[y\]-intercept, substituting the value of \[x\] in the equation we get,
\[ \Rightarrow y = \dfrac{{ - 4}}{3}\left( 0 \right) + 4\],
Now simplifying we get,
\[ \Rightarrow y = 4\],
So, the \[y\]-intercept will be \[\left( {0,4} \right)\],
Now assume \[y = 0\] to find the \[x\]-intercept, substituting the value of \[y\] in the equation we get,
\[ \Rightarrow 0 = \dfrac{{ - 4}}{3}x + 4\],
Now subtracting 4 on both sides we get,
\[ \Rightarrow 0 - 4 = \dfrac{{ - 4}}{3}x + 4 - 4\],
Now eliminating the like terms we get,
\[ \Rightarrow - 4 = \dfrac{{ - 4}}{3}x\],
Now simplifying we get,
\[ \Rightarrow \dfrac{1}{3}x = 1\],
Now multiplying 3 on both sides, we get,
\[ \Rightarrow \dfrac{1}{3}x \times 3 = 1 \times 3\],
Now further simplification we get,
\[ \Rightarrow x = 3\],
So, \[x\]-intercept will be \[\left( {3,0} \right)\].
Plotting the points on the graph we get,
Note: A linear graph is a single straight line, to draw a linear graph, we need to locate some points on the graph, join these points if the line joining these points is a straight line, then the graph is a linear graph.
We can plot the linear graph by 3 methods, they are:
Plotting points: Assuming the values for \[x\] and find the corresponding value of \[y\], plot the points on the graph.
X- and Y- intercepts: If we have to find \[x\]-intercept we have to put \[y = 0\], and if we have to find \[y\]-intercept we have to put \[x = 0\], now plot the points on the graph.
Slope-intercept form: Plot the point after finding the \[y\]-intercept, now use the slope and find another point and plot the point using \[y\]-intercept, by joining the points we will get the straight line.

Recently Updated Pages
Master Class 12 Economics: Engaging Questions & Answers for Success
Master Class 12 English: Engaging Questions & Answers for Success
Master Class 12 Social Science: Engaging Questions & Answers for Success
Master Class 12 Maths: Engaging Questions & Answers for Success
Master Class 12 Physics: Engaging Questions & Answers for Success
Master Class 8 English: Engaging Questions & Answers for Success
Trending doubts
What is BLO What is the full form of BLO class 8 social science CBSE
Citizens of India can vote at the age of A 18 years class 8 social science CBSE
Right to vote is a AFundamental Right BFundamental class 8 social science CBSE
Full form of STD, ISD and PCO
What is the area formula of an obtuse triangle class 8 maths CBSE
Give me the opposite gender of Duck class 8 english CBSE