


How do you graph $-4x+y=2$?
Answer
589.5k+ views
Hint: To draw the graph of the given equation $-4x+y=2$. First of all, we are going to put $x$ equal to 0 in this equation and then will see the value of y we are getting. Then we will plot this point where x is 0 and the y corresponding to this x graphically. After that we are going to put $y$ equal to 0 in the above equation and see the values of $x$ we are getting and then plot these x and y coordinates on the graph. Now, we will join these two points to get the straight line.
Complete answer:
The equation of a straight line which we are given is as follows:
$-4x+y=2$
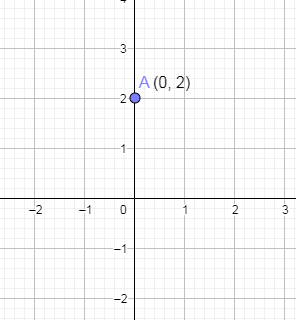
Now, we are going to substitute the value of $x$ equal to 0 in the above equation.
$\begin{align}
& -4\left( 0 \right)+y=2 \\
& \Rightarrow y=2 \\
\end{align}$
From the above, we got the point $\left( 0,2 \right)$. Now, we are going to plot this point on the graph paper.
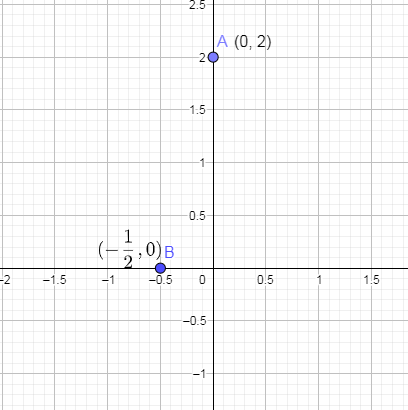
Now, we are going to substitute y equal to 0 in the above equation.
$\begin{align}
& -4x+0=2 \\
& \Rightarrow -4x=2 \\
\end{align}$
Dividing -4 on both the sides we get,
$x=-\dfrac{2}{4}=-\dfrac{1}{2}$
From the above, the x and y coordinates of the second point are $\left( -\dfrac{1}{2},0 \right)$ . Let us draw this point $\left( -\dfrac{1}{2},0 \right)$ on the graph paper and we get,
Now, to draw the equation of a straight line we are going to join these two points A and B and we will get,
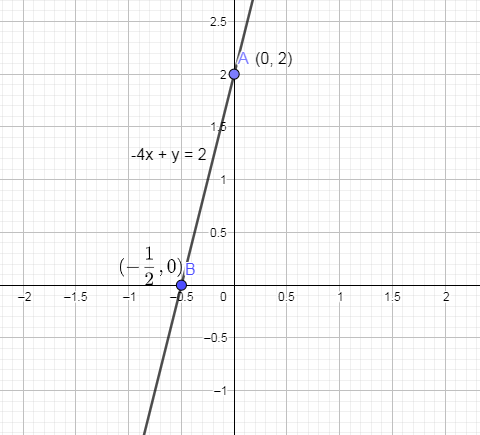
Hence, we have graphically drawn the given equation of a straight line.
Note: We can check the straight line that we drew is correct or not by taking a point on the straight line whose x coordinate is -1 and then to know the y coordinate of that point we are going to draw a perpendicular from this point on to the y axis. The foot of the perpendicular is the coordinate of y axis of that point.
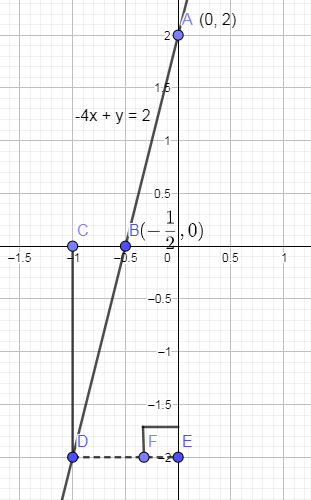
In the above figure, the dotted line segment DE is the perpendicular drawn from point D to y axis and the foot of the perpendicular is -2. Hence, the y coordinate of that point D on the straight line is -2.
Now, we can check whether the y coordinate of point D is -2 or not. Let us substitute the x coordinate as -1 in the above equation we get,
$\begin{align}
& -4\left( -1 \right)+y=2 \\
& \Rightarrow 4+y=2 \\
& \Rightarrow y=-2 \\
\end{align}$
From the above, we have got the same value of y which we got from the graph. Hence, the graph that we drew corresponding to the given equation is correct.
Complete answer:
The equation of a straight line which we are given is as follows:
$-4x+y=2$
Now, we are going to substitute the value of $x$ equal to 0 in the above equation.
$\begin{align}
& -4\left( 0 \right)+y=2 \\
& \Rightarrow y=2 \\
\end{align}$
From the above, we got the point $\left( 0,2 \right)$. Now, we are going to plot this point on the graph paper.
Now, we are going to substitute y equal to 0 in the above equation.
$\begin{align}
& -4x+0=2 \\
& \Rightarrow -4x=2 \\
\end{align}$
Dividing -4 on both the sides we get,
$x=-\dfrac{2}{4}=-\dfrac{1}{2}$
From the above, the x and y coordinates of the second point are $\left( -\dfrac{1}{2},0 \right)$ . Let us draw this point $\left( -\dfrac{1}{2},0 \right)$ on the graph paper and we get,
Now, to draw the equation of a straight line we are going to join these two points A and B and we will get,
Hence, we have graphically drawn the given equation of a straight line.
Note: We can check the straight line that we drew is correct or not by taking a point on the straight line whose x coordinate is -1 and then to know the y coordinate of that point we are going to draw a perpendicular from this point on to the y axis. The foot of the perpendicular is the coordinate of y axis of that point.
In the above figure, the dotted line segment DE is the perpendicular drawn from point D to y axis and the foot of the perpendicular is -2. Hence, the y coordinate of that point D on the straight line is -2.
Now, we can check whether the y coordinate of point D is -2 or not. Let us substitute the x coordinate as -1 in the above equation we get,
$\begin{align}
& -4\left( -1 \right)+y=2 \\
& \Rightarrow 4+y=2 \\
& \Rightarrow y=-2 \\
\end{align}$
From the above, we have got the same value of y which we got from the graph. Hence, the graph that we drew corresponding to the given equation is correct.
Recently Updated Pages
Master Class 12 Economics: Engaging Questions & Answers for Success
Master Class 12 English: Engaging Questions & Answers for Success
Master Class 12 Social Science: Engaging Questions & Answers for Success
Master Class 12 Maths: Engaging Questions & Answers for Success
Master Class 12 Physics: Engaging Questions & Answers for Success
Master Class 9 General Knowledge: Engaging Questions & Answers for Success
Trending doubts
One Metric ton is equal to kg A 10000 B 1000 C 100 class 11 physics CBSE
Difference Between Prokaryotic Cells and Eukaryotic Cells
Two of the body parts which do not appear in MRI are class 11 biology CBSE
1 ton equals to A 100 kg B 1000 kg C 10 kg D 10000 class 11 physics CBSE
Draw a diagram of nephron and explain its structur class 11 biology CBSE
10 examples of friction in our daily life