


How do you graph $3y + 5 = 0$ ?
Answer
600.9k+ views
Hint: In order to solve this sum, we first need to solve the given equation which is $3y + 5 = 0$. We solve the sum and isolate $y$ then equate it with the standard slope-intercept formula to find that our slope/gradient is zero and $y$ is a constant, thus we only plot a horizontal line on our graph.
Complete step-by-step solution:
The given equation is $3y + 5 = 0$. In order to plot the graph, we need to solve it and get our respective values.
Thus in order to solve the given equation, we subtract $ - 5$ from both sides of the equation:
$3y + 5 - 5 = 0 - 5$
$ \Rightarrow 3y = - 5$
Now we divide both sides of the equation with $3$ to isolate our $y$
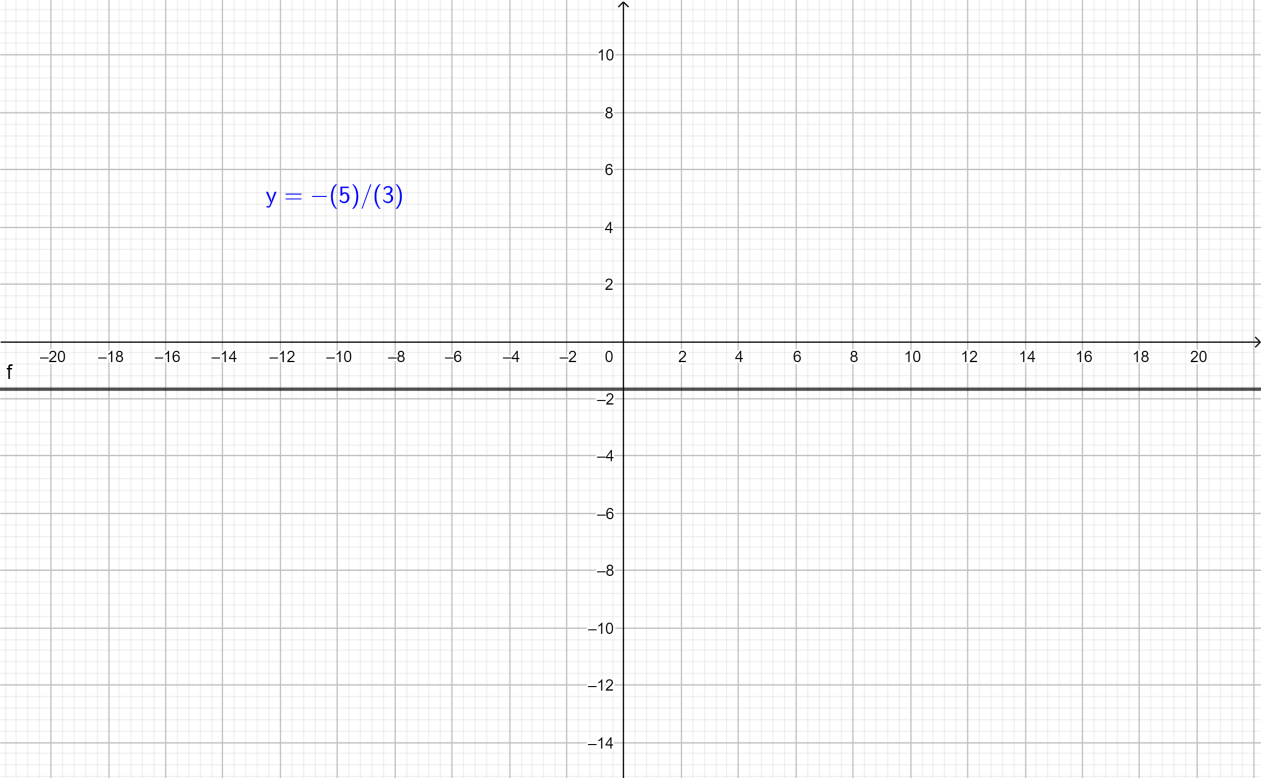
$y = - \dfrac{5}{3}$
This is in the form of the slope –intercept form which is represented as: $y = mx + c$
Here $y$ is a constant, $m$ is the slope and $c$ is the intercept on the y-axis. But since we do not have any variable of $x$ in the equation that we have found, hence we can say that slope is equal to zero. Thus, if we plot $y = - \dfrac{5}{3}$ on a graph, it will be a straight line.
Note: An equation of a straight line is most commonly expressed in the form of $y = mx + c$ - which is also known as the slope-intercept form as it expresses the value of x and y in terms of the slope $m$ and intercept.
Any line parallel to the x-axis or the x-axis itself is called the horizontal line while any line parallel to the y-axis or the y-axis itself is called a vertical line.
The slope of every horizontal line is zero. Slope of the y-axis is not defined.
Complete step-by-step solution:
The given equation is $3y + 5 = 0$. In order to plot the graph, we need to solve it and get our respective values.
Thus in order to solve the given equation, we subtract $ - 5$ from both sides of the equation:
$3y + 5 - 5 = 0 - 5$
$ \Rightarrow 3y = - 5$
Now we divide both sides of the equation with $3$ to isolate our $y$
$y = - \dfrac{5}{3}$
This is in the form of the slope –intercept form which is represented as: $y = mx + c$
Here $y$ is a constant, $m$ is the slope and $c$ is the intercept on the y-axis. But since we do not have any variable of $x$ in the equation that we have found, hence we can say that slope is equal to zero. Thus, if we plot $y = - \dfrac{5}{3}$ on a graph, it will be a straight line.
Note: An equation of a straight line is most commonly expressed in the form of $y = mx + c$ - which is also known as the slope-intercept form as it expresses the value of x and y in terms of the slope $m$ and intercept.
Any line parallel to the x-axis or the x-axis itself is called the horizontal line while any line parallel to the y-axis or the y-axis itself is called a vertical line.
The slope of every horizontal line is zero. Slope of the y-axis is not defined.
Recently Updated Pages
Master Class 11 English: Engaging Questions & Answers for Success
Master Class 11 Social Science: Engaging Questions & Answers for Success
Master Class 11 Maths: Engaging Questions & Answers for Success
Master Class 11 Biology: Engaging Questions & Answers for Success
Master Class 11 Physics: Engaging Questions & Answers for Success
Master Class 11 Chemistry: Engaging Questions & Answers for Success
Trending doubts
In Indian rupees 1 trillion is equal to how many c class 8 maths CBSE
What is BLO What is the full form of BLO class 8 social science CBSE
What are the 12 elements of nature class 8 chemistry CBSE
Citizens of India can vote at the age of A 18 years class 8 social science CBSE
Which of the following leader has given the term insensate class 8 social science CBSE
Name the states through which the Tropic of Cancer class 8 social science CBSE