


How do you graph $3x-y=1$ ?
Answer
582.6k+ views
Hint: Try to get the equation in terms of ‘y’ which can be compared to the slope intercept form where we can the slope and ‘y’- intercept. For plotting the graph we need minimum two points which can be obtained by putting ‘x’ and ‘y’ value 0 alternatively in the converted equation.
Complete step by step answer:
At first, we have to get the given equation in terms of ‘y’
$3x-y=1$
Solving for ‘y’
$\Rightarrow -y=-3x+1$
Multiplying $-1$ both the sides we get,
$\begin{align}
& \Rightarrow \left( -y \right)\cdot \left( -1 \right)=\left( -3x+1 \right)\cdot \left( -1 \right) \\
& \Rightarrow y=3x-1 \\
\end{align}$
Slope intercept form: we can write the equation of straight line in slope intercept form i.e. $y=mx+c$, where ‘m’ is the slope and ‘c’ is the intercept on ‘y’- axis.
Comparing our equation $y=3x-1$ with slope point form, we get
Slope $m=3$ and
‘y’- intercept $c=-1$
Now for plotting the graph we need at least two points.
For the first point:
Putting $x=0$ in $y=3x-1$, we get
$y=3\times 0-1=0-1=-1$
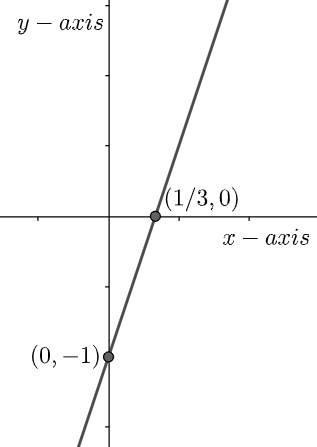
So, the point is $\left( 0,-1 \right)$
Putting $y=0$ in $y=3x-1$, we get
$\begin{align}
& \Rightarrow 0=3x-1 \\
& \Rightarrow 3x=1 \\
& \Rightarrow x=\frac{1}{3} \\
\end{align}$
So, the point is $\left( \dfrac{1}{3},0 \right)$
The graph can be plotted with these two points as
Note: Points obtained by putting the values of ‘x’ and ‘y’ as 0 in the equation $y=3x-1$, can also be obtained by taking any random values of ‘x’ and ‘y’. These points can also be put in a tabular form which is also a method from where the graph can be plotted. It should be remembered that the two points are not the end points of the straight line. The line only passes through them.
Complete step by step answer:
At first, we have to get the given equation in terms of ‘y’
$3x-y=1$
Solving for ‘y’
$\Rightarrow -y=-3x+1$
Multiplying $-1$ both the sides we get,
$\begin{align}
& \Rightarrow \left( -y \right)\cdot \left( -1 \right)=\left( -3x+1 \right)\cdot \left( -1 \right) \\
& \Rightarrow y=3x-1 \\
\end{align}$
Slope intercept form: we can write the equation of straight line in slope intercept form i.e. $y=mx+c$, where ‘m’ is the slope and ‘c’ is the intercept on ‘y’- axis.
Comparing our equation $y=3x-1$ with slope point form, we get
Slope $m=3$ and
‘y’- intercept $c=-1$
Now for plotting the graph we need at least two points.
For the first point:
Putting $x=0$ in $y=3x-1$, we get
$y=3\times 0-1=0-1=-1$
So, the point is $\left( 0,-1 \right)$
Putting $y=0$ in $y=3x-1$, we get
$\begin{align}
& \Rightarrow 0=3x-1 \\
& \Rightarrow 3x=1 \\
& \Rightarrow x=\frac{1}{3} \\
\end{align}$
So, the point is $\left( \dfrac{1}{3},0 \right)$
The graph can be plotted with these two points as
Note: Points obtained by putting the values of ‘x’ and ‘y’ as 0 in the equation $y=3x-1$, can also be obtained by taking any random values of ‘x’ and ‘y’. These points can also be put in a tabular form which is also a method from where the graph can be plotted. It should be remembered that the two points are not the end points of the straight line. The line only passes through them.
Recently Updated Pages
Master Class 11 Social Science: Engaging Questions & Answers for Success
Master Class 11 English: Engaging Questions & Answers for Success
Master Class 11 Maths: Engaging Questions & Answers for Success
Master Class 11 Chemistry: Engaging Questions & Answers for Success
Master Class 11 Biology: Engaging Questions & Answers for Success
Master Class 11 Physics: Engaging Questions & Answers for Success
Trending doubts
One Metric ton is equal to kg A 10000 B 1000 C 100 class 11 physics CBSE
Difference Between Prokaryotic Cells and Eukaryotic Cells
Draw a diagram of a plant cell and label at least eight class 11 biology CBSE
Two of the body parts which do not appear in MRI are class 11 biology CBSE
Which gas is abundant in air class 11 chemistry CBSE
10 examples of friction in our daily life