


How do you graph \[-3x-2y=-2\]?
Answer
548.7k+ views
Hint: We are asked to draw the graph of the equation \[-3x-2y=-2\]. The degree of an equation is the highest power of the variable present in it. So, for this equation, the highest power present \[x\] is 1, the degree is also 1. From this, it can be said that this is a linear equation. The graph of a linear equation represents a straight line.
Complete step by step answer:
The general equation of a straight line is \[ax+by+c=0\], where \[a,b,c\] are any real numbers. The given equation is \[-3x-2y=-2\], the equation can also be written as \[3x+2y-2=0\], comparing with the general equation of straight line, we get \[a=3,b=2\And c=-2\].
To plot the graph of an equation of the straight line, we should know at least two points, through which the line passes.
To make things simple, let’s take the X-intercept and Y-intercept as the two points. X-intercept is the point where the line crosses X-axis, this means that the Y-coordinate will be \[0\], similarly Y-intercept is the point where the line crosses Y-axis, so X-coordinate will be \[0\]. We will use this property now.
We substitute \[y=0\] in the equation \[3x+2y-2=0\], we get
\[\begin{align}
& \Rightarrow 3x+2(0)-2=0 \\
& \Rightarrow 3x-2=0 \\
\end{align}\]
Adding 2 to both sides of the equation we get,
\[\begin{align}
& \Rightarrow 3x+2-2=0+2 \\
& \Rightarrow 3x=2 \\
\end{align}\]
We divide 3 to both sides we get,
\[\begin{align}
& \Rightarrow \dfrac{3x}{3}=\dfrac{2}{3} \\
& \therefore x=\dfrac{2}{3} \\
\end{align}\]
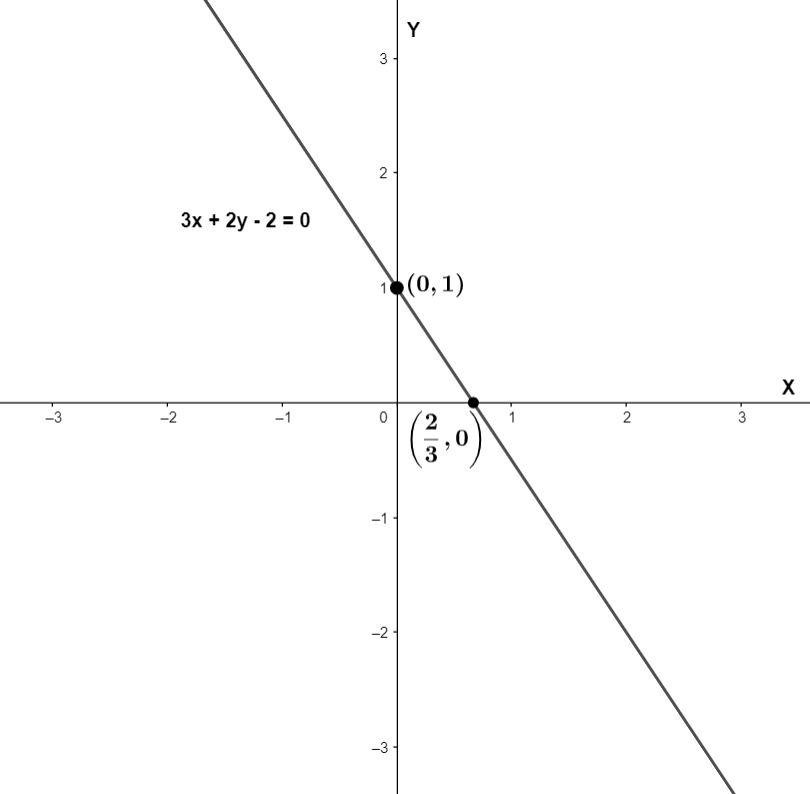
So, the coordinates of the X-intercept are \[\left( \dfrac{2}{3},0 \right)\].
Similarly, now we substitute \[x=0\] in the equation, we get
\[\begin{align}
& \Rightarrow 3(0)+2y-2=0 \\
& \Rightarrow 2y-2=0 \\
\end{align}\]
Adding 2 to both sides of the equation, we get
\[\begin{align}
& \Rightarrow 2y+2-2=0+2 \\
& \Rightarrow 2y=2 \\
\end{align}\]
Dividing both sides of above equation by 2, we get
\[\begin{align}
& \Rightarrow \dfrac{2y}{2}=\dfrac{2}{2} \\
& \therefore y=1 \\
\end{align}\]
So, the coordinates of the Y-intercept are \[\left( 0,1 \right)\].
Using these two points we can plot the graph of the equation as follows:
Note: Here, we found the two points which are X-intercept and Y-intercept by substituting either x or \[y\] to be zero, one at a time. We can also find these values by converting the straight-line equation to the equation in intercept form which is, \[\dfrac{x}{a}+\dfrac{y}{b}=1\]. Here, \[a\And b\] are X-intercept and Y-intercept respectively.
We can also use other forms like slope-intercept form to graph the equation.
Complete step by step answer:
The general equation of a straight line is \[ax+by+c=0\], where \[a,b,c\] are any real numbers. The given equation is \[-3x-2y=-2\], the equation can also be written as \[3x+2y-2=0\], comparing with the general equation of straight line, we get \[a=3,b=2\And c=-2\].
To plot the graph of an equation of the straight line, we should know at least two points, through which the line passes.
To make things simple, let’s take the X-intercept and Y-intercept as the two points. X-intercept is the point where the line crosses X-axis, this means that the Y-coordinate will be \[0\], similarly Y-intercept is the point where the line crosses Y-axis, so X-coordinate will be \[0\]. We will use this property now.
We substitute \[y=0\] in the equation \[3x+2y-2=0\], we get
\[\begin{align}
& \Rightarrow 3x+2(0)-2=0 \\
& \Rightarrow 3x-2=0 \\
\end{align}\]
Adding 2 to both sides of the equation we get,
\[\begin{align}
& \Rightarrow 3x+2-2=0+2 \\
& \Rightarrow 3x=2 \\
\end{align}\]
We divide 3 to both sides we get,
\[\begin{align}
& \Rightarrow \dfrac{3x}{3}=\dfrac{2}{3} \\
& \therefore x=\dfrac{2}{3} \\
\end{align}\]
So, the coordinates of the X-intercept are \[\left( \dfrac{2}{3},0 \right)\].
Similarly, now we substitute \[x=0\] in the equation, we get
\[\begin{align}
& \Rightarrow 3(0)+2y-2=0 \\
& \Rightarrow 2y-2=0 \\
\end{align}\]
Adding 2 to both sides of the equation, we get
\[\begin{align}
& \Rightarrow 2y+2-2=0+2 \\
& \Rightarrow 2y=2 \\
\end{align}\]
Dividing both sides of above equation by 2, we get
\[\begin{align}
& \Rightarrow \dfrac{2y}{2}=\dfrac{2}{2} \\
& \therefore y=1 \\
\end{align}\]
So, the coordinates of the Y-intercept are \[\left( 0,1 \right)\].
Using these two points we can plot the graph of the equation as follows:
Note: Here, we found the two points which are X-intercept and Y-intercept by substituting either x or \[y\] to be zero, one at a time. We can also find these values by converting the straight-line equation to the equation in intercept form which is, \[\dfrac{x}{a}+\dfrac{y}{b}=1\]. Here, \[a\And b\] are X-intercept and Y-intercept respectively.
We can also use other forms like slope-intercept form to graph the equation.

Recently Updated Pages
Master Class 8 Social Science: Engaging Questions & Answers for Success
Master Class 8 English: Engaging Questions & Answers for Success
Class 8 Question and Answer - Your Ultimate Solutions Guide
Master Class 8 Maths: Engaging Questions & Answers for Success
Master Class 8 Science: Engaging Questions & Answers for Success
Master Class 7 English: Engaging Questions & Answers for Success
Trending doubts
Difference Between Plant Cell and Animal Cell
Fill the blanks with the suitable prepositions 1 The class 9 english CBSE
Who is eligible for RTE class 9 social science CBSE
Which places in India experience sunrise first and class 9 social science CBSE
What is pollution? How many types of pollution? Define it
Name 10 Living and Non living things class 9 biology CBSE