


How do you graph $3x + y = - 2$?
Answer
587.7k+ views
Hint: First, we have to make the given linear equation in Slope-intercept form and then calculate the value of $y$ for any two arbitrary values of $x$. Next make a table of these values of $x$ and $y$. Next plot the obtained points on the graph paper and draw a line passing through these points.
Formula used:
Slope Intercept of a line:
The equation of a line with slope $m$ and making an intercept $c$ on $y$-axis is $y = mx + c$.
Complete step by step answer:
Given linear equation in two variables: $3x + y = - 2$
First, we have to make the given linear equation in Slope-intercept form.
So, subtract $3x$ from both sides of the equation.
$y = - 2 - 3x$
Now, we have to calculate the value of $y$ for any two arbitrary values of $x$. Thus, finding the value of $y$ when $x = 0$ and $x = 1$.
When $x = 0$, $y = - 2 - 3 \cdot 0 = - 2$
When $x = 1$, $y = - 2 - 3 \cdot 1 = - 5$
Now we have to make a table of these values of $x$ and $y$.
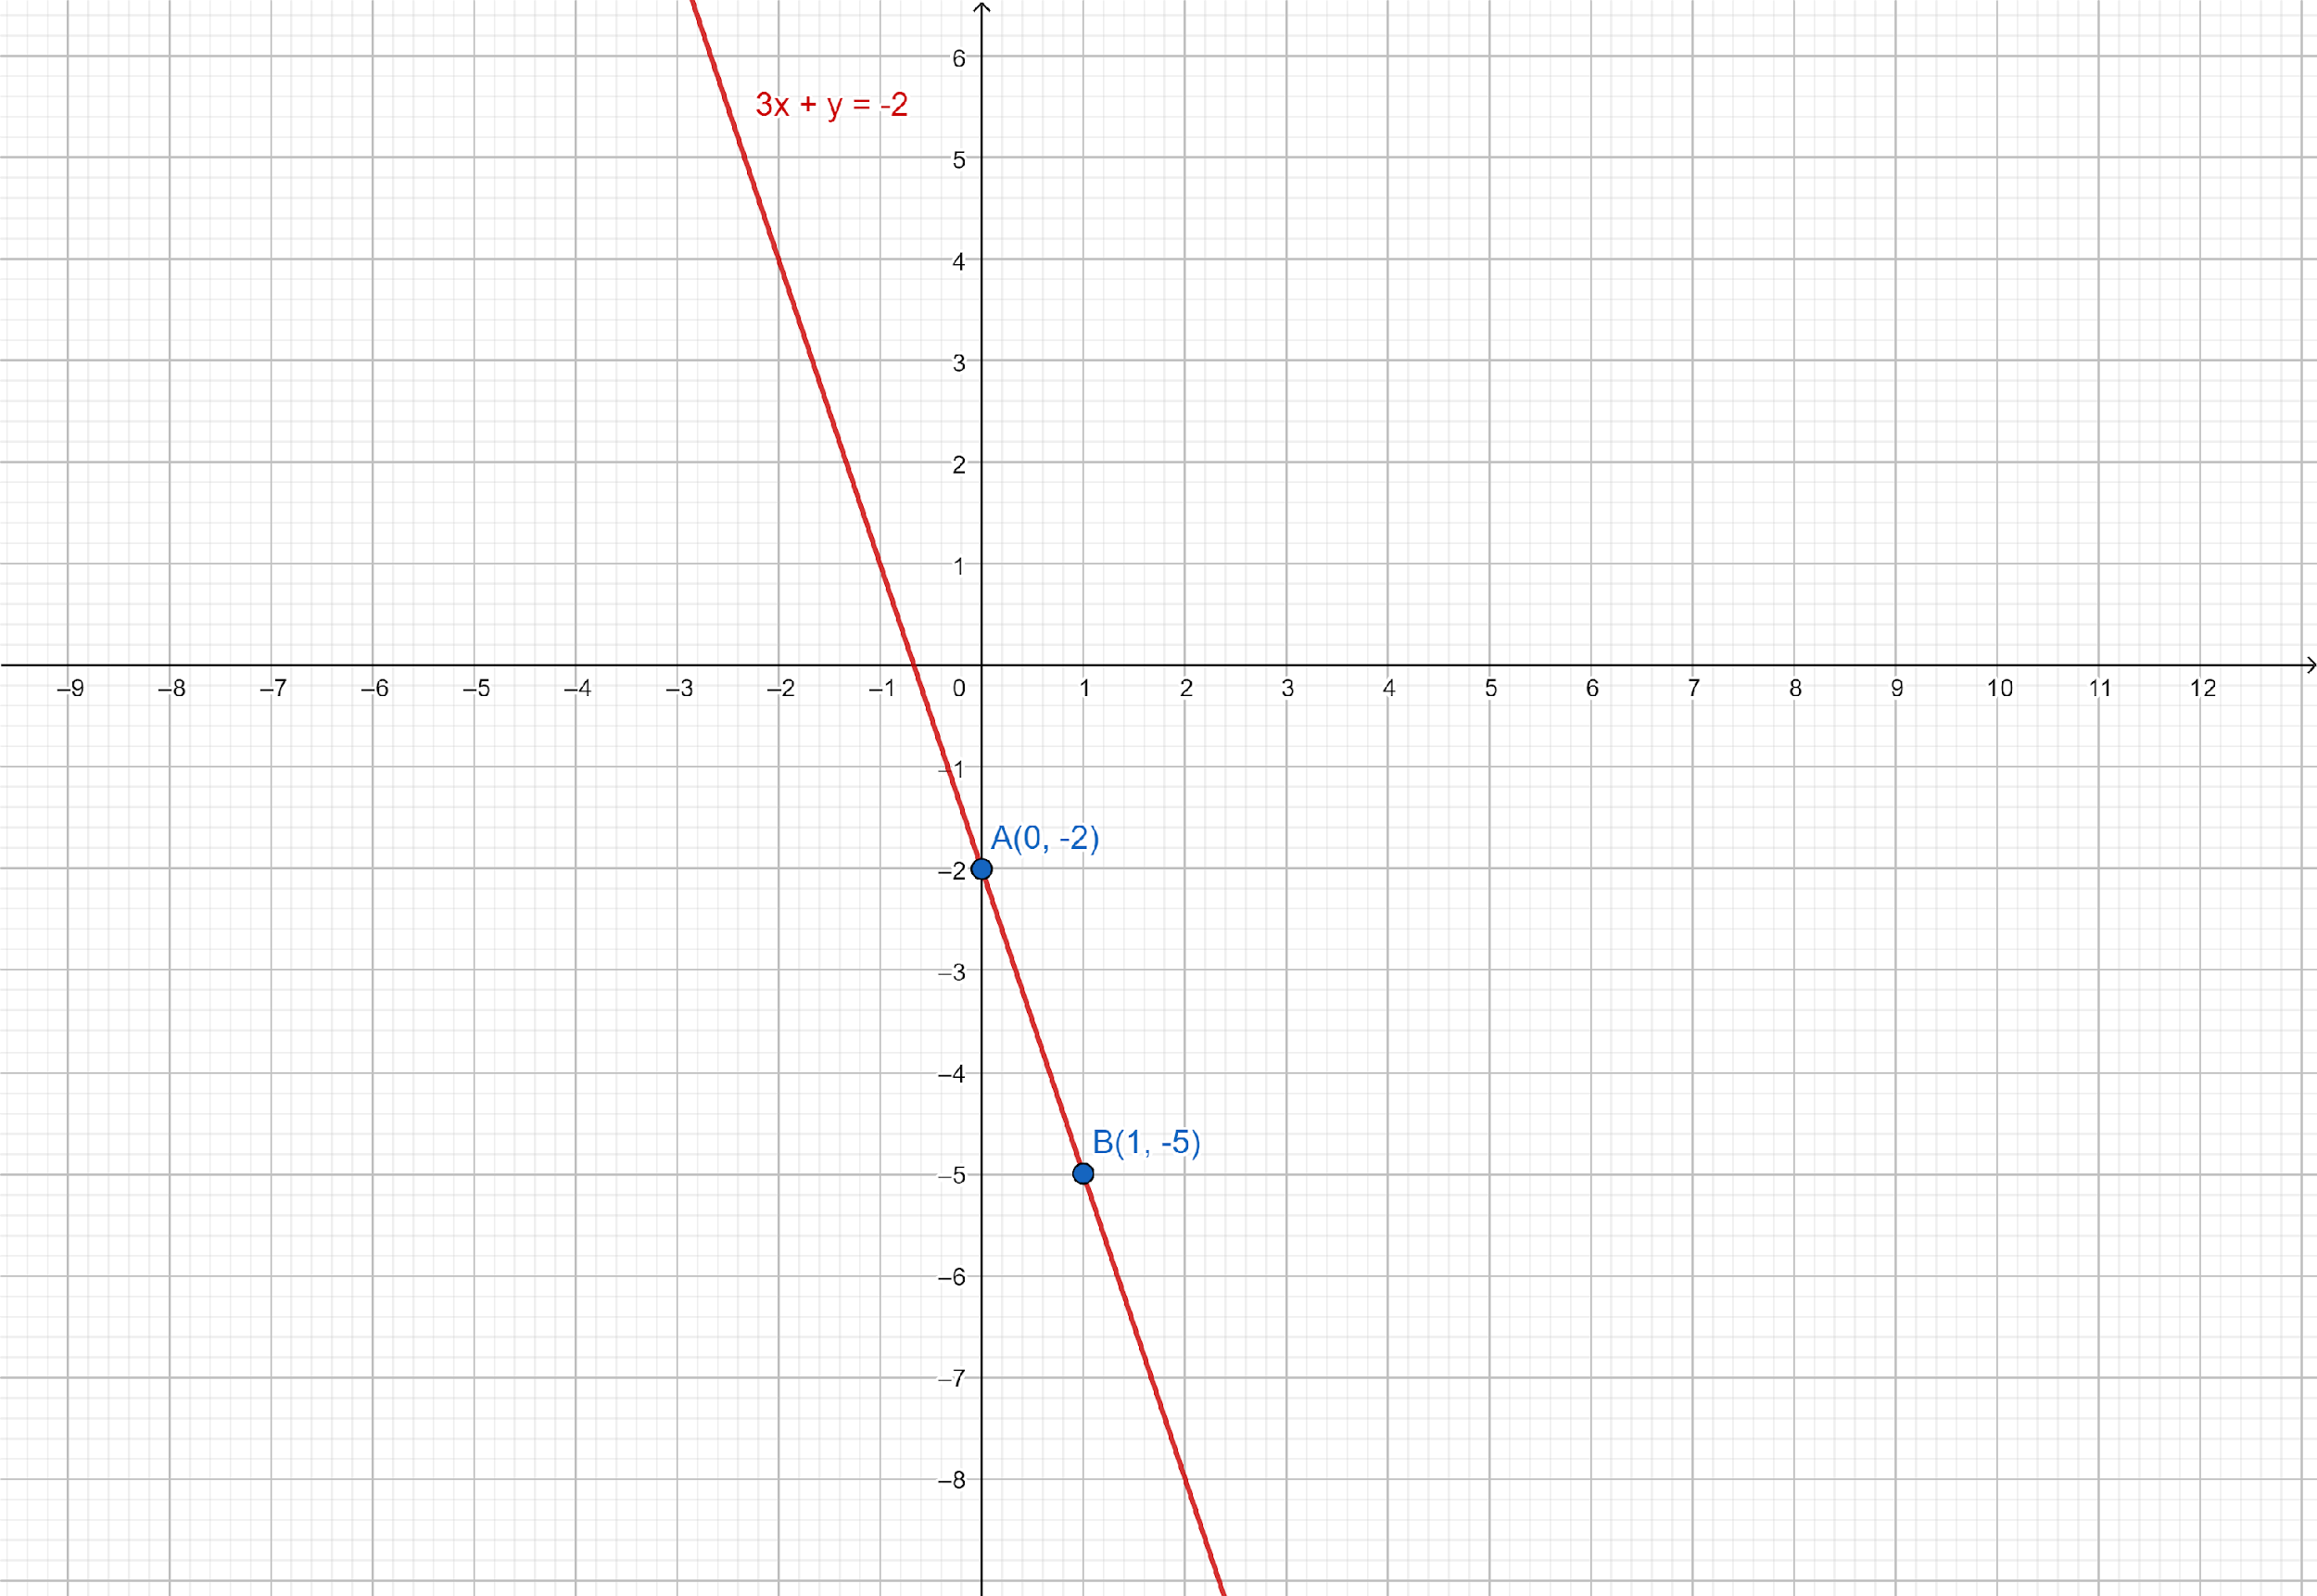
Now we have to plot the points $A\left( {0, - 2} \right)$ and $B\left( {1, - 5} \right)$ on the graph paper and draw a line passing through $A$ and $B$.
Final solution: Hence, the straight line, so obtained, is the required graph of the given linear equation.
Note: Method to draw the graph of linear equation in two variables:
Step I: Write a given linear equation and express y in terms of x.
Step II: Put different values of x and find the corresponding value of y.
Step III: Form a table by writing the values of y below the corresponding values of x.
Step IV: Plot these points on graph paper.
Step V: Join these points. Thus, we get a straight line and produce it on both sides.
Hence, the straight line, so obtained, is the required graph of the given linear equation.
Formula used:
Slope Intercept of a line:
The equation of a line with slope $m$ and making an intercept $c$ on $y$-axis is $y = mx + c$.
Complete step by step answer:
Given linear equation in two variables: $3x + y = - 2$
First, we have to make the given linear equation in Slope-intercept form.
So, subtract $3x$ from both sides of the equation.
$y = - 2 - 3x$
Now, we have to calculate the value of $y$ for any two arbitrary values of $x$. Thus, finding the value of $y$ when $x = 0$ and $x = 1$.
When $x = 0$, $y = - 2 - 3 \cdot 0 = - 2$
When $x = 1$, $y = - 2 - 3 \cdot 1 = - 5$
Now we have to make a table of these values of $x$ and $y$.
| $x$ | $0$ | $1$ |
| $y$ | $ - 2$ | $ - 5$ |
Now we have to plot the points $A\left( {0, - 2} \right)$ and $B\left( {1, - 5} \right)$ on the graph paper and draw a line passing through $A$ and $B$.
Final solution: Hence, the straight line, so obtained, is the required graph of the given linear equation.
Note: Method to draw the graph of linear equation in two variables:
Step I: Write a given linear equation and express y in terms of x.
Step II: Put different values of x and find the corresponding value of y.
Step III: Form a table by writing the values of y below the corresponding values of x.
Step IV: Plot these points on graph paper.
Step V: Join these points. Thus, we get a straight line and produce it on both sides.
Hence, the straight line, so obtained, is the required graph of the given linear equation.
Recently Updated Pages
Master Class 11 English: Engaging Questions & Answers for Success
Master Class 11 Social Science: Engaging Questions & Answers for Success
Master Class 11 Maths: Engaging Questions & Answers for Success
Master Class 11 Biology: Engaging Questions & Answers for Success
Master Class 11 Physics: Engaging Questions & Answers for Success
Master Class 11 Chemistry: Engaging Questions & Answers for Success
Trending doubts
One Metric ton is equal to kg A 10000 B 1000 C 100 class 11 physics CBSE
Difference Between Prokaryotic Cells and Eukaryotic Cells
Difference between physical and chemical change class 11 chemistry CBSE
Find the value of the expression given below sin 30circ class 11 maths CBSE
Two of the body parts which do not appear in MRI are class 11 biology CBSE
Draw a diagram of a plant cell and label at least eight class 11 biology CBSE