


How do you graph \[3x+y=-6\] ?
Answer
564.9k+ views
Hint: We can draw this graph using the concept of slope intercept form. First we have to find the x and y intercepts of the equation. We can draw using these points but for more accuracy we will find the gradient between the points and we will draw the graph.
Complete step by step answer:
Let us know how to find the gradient.
We have to choose two points on the line and we have to subtract the ordinates of two points and will divide with value obtained by subtracting abscissas of the points. The formula looks like
If the points are \[\left( {{x}_{1}},{{y}_{1}} \right)\left( {{x}_{2}},{{y}_{2}} \right)\] then the gradient will be
\[gradient=\dfrac{{{y}_{2}}-{{y}_{1}}}{{{x}_{2}}-{{x}_{1}}}\]
Using the gradient we will find the x and y coordinates the numerator is y coordinate and denominator is x coordinate.
First we have to find x and y coordinates.
To find the x intercept we have to substitute the y value as \[0\].
We will get
\[\Rightarrow 3x+0=-6\]
\[\Rightarrow 3x=-6\]
Now we have divide the equation with 3 on both sides
\[\Rightarrow \dfrac{3x}{3}=\dfrac{-6}{3}\]
We will get
\[\Rightarrow x=-2\]
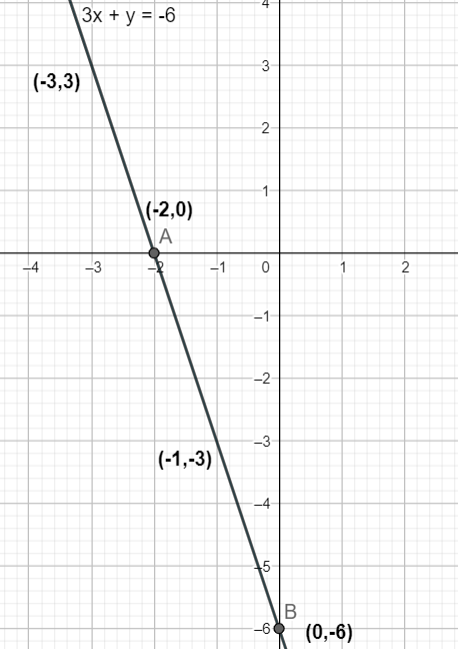
Now the coordinate is \[\left( -2,0 \right)\].
Now we will find the y intercept we have to substitute x value as \[0\]
We will get
\[\Rightarrow 3\times 0+y=-6\]
\[\Rightarrow y=-6\]
So the point we will get is \[\left( 0,-6 \right)\]
These two are enough to draw the graph.
But for better understanding we will derive some more points using gradients.
We have two points \[\left( -2,0 \right)\] and \[\left( 0,-6 \right)\]
From this the gradient we will obtain is
\[gradient=\dfrac{-6-0}{0-\left( -2 \right)}\]
By simplifying we will get
\[\Rightarrow gradient=\dfrac{-6}{2}\]
We will get
\[\Rightarrow gradient=-\dfrac{3}{1}\]
So from this we will get the point as \[\left( -1,-3 \right)\]
Using these points we will draw the graph.
We will get
Note:
We can repeat the gradient technique to find different other points to plot the graph. The sign of the gradient will help you to know whether the graph will go upwards or downwards. Positive sign will indicate upwards and negative sign downwards.
Complete step by step answer:
Let us know how to find the gradient.
We have to choose two points on the line and we have to subtract the ordinates of two points and will divide with value obtained by subtracting abscissas of the points. The formula looks like
If the points are \[\left( {{x}_{1}},{{y}_{1}} \right)\left( {{x}_{2}},{{y}_{2}} \right)\] then the gradient will be
\[gradient=\dfrac{{{y}_{2}}-{{y}_{1}}}{{{x}_{2}}-{{x}_{1}}}\]
Using the gradient we will find the x and y coordinates the numerator is y coordinate and denominator is x coordinate.
First we have to find x and y coordinates.
To find the x intercept we have to substitute the y value as \[0\].
We will get
\[\Rightarrow 3x+0=-6\]
\[\Rightarrow 3x=-6\]
Now we have divide the equation with 3 on both sides
\[\Rightarrow \dfrac{3x}{3}=\dfrac{-6}{3}\]
We will get
\[\Rightarrow x=-2\]
Now the coordinate is \[\left( -2,0 \right)\].
Now we will find the y intercept we have to substitute x value as \[0\]
We will get
\[\Rightarrow 3\times 0+y=-6\]
\[\Rightarrow y=-6\]
So the point we will get is \[\left( 0,-6 \right)\]
These two are enough to draw the graph.
But for better understanding we will derive some more points using gradients.
We have two points \[\left( -2,0 \right)\] and \[\left( 0,-6 \right)\]
From this the gradient we will obtain is
\[gradient=\dfrac{-6-0}{0-\left( -2 \right)}\]
By simplifying we will get
\[\Rightarrow gradient=\dfrac{-6}{2}\]
We will get
\[\Rightarrow gradient=-\dfrac{3}{1}\]
So from this we will get the point as \[\left( -1,-3 \right)\]
Using these points we will draw the graph.
We will get
Note:
We can repeat the gradient technique to find different other points to plot the graph. The sign of the gradient will help you to know whether the graph will go upwards or downwards. Positive sign will indicate upwards and negative sign downwards.
Recently Updated Pages
Basicity of sulphurous acid and sulphuric acid are
Master Class 11 Business Studies: Engaging Questions & Answers for Success
Master Class 11 Computer Science: Engaging Questions & Answers for Success
Master Class 11 Economics: Engaging Questions & Answers for Success
Master Class 11 Social Science: Engaging Questions & Answers for Success
Master Class 11 English: Engaging Questions & Answers for Success
Trending doubts
One Metric ton is equal to kg A 10000 B 1000 C 100 class 11 physics CBSE
The largest wind power cluster is located in the state class 11 social science CBSE
Explain zero factorial class 11 maths CBSE
State and prove Bernoullis theorem class 11 physics CBSE
Which among the following are examples of coming together class 11 social science CBSE
Can anyone list 10 advantages and disadvantages of friction