


How do you graph $ 2y\le x-5 $ ?
Answer
543.9k+ views
Hint: First construct the equation of the boundary line for the given inequality by replacing the inequality sign by the equality sign. Then draw the line by finding its intercepts. Later, find the region of the inequality according to the sign in the inequality.
Complete step by step solution:
The given inequality in the question is $ 2y\le x-5 $ .
First write the inequality in the form $ ay+bx+c\le 0 $ , where a is positive.
Then, we get that $ 2y-x+5\le 0 $
To plot the graph of such type of inequality in 2 variables, first draw the graph of the line which we get by replacing the inequality sign by the equality sign.
In this case, we have replaced the ‘ $ \ge $ ’ by ‘=’ sign.
With this, the equation of the line is $ 2y-x+5=0 $ …. (i)
Substitute $ x=0 $ in equation (i) to find the y intercept of the line.
Then,
$ \Rightarrow 2y-0+5=0 $
$ \Rightarrow y=-\dfrac{5}{2} $
Now, substitute $ y=0 $ in equation (i) to find the x intercept of the line.
Then,
$ \Rightarrow 2(0)-x+5=0 $
$ \Rightarrow x=5 $
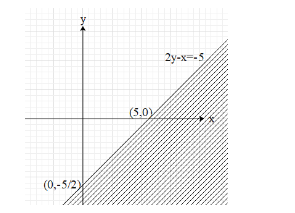
This means that the x and the y intercepts of the required line are $ \left( 5,0 \right) $ and $ \left( 0,-\dfrac{5}{2} \right) $ respectively.
Now, plot the two points, $ \left( 5,0 \right) $ and $ \left( 0,-\dfrac{5}{2} \right) $ on a cartesian plane and then join the two points by drawing a line, passing through them.
Since in the inequality it is less than or equal to sign, the graph for the inequality is the region below the line $ 2y-x+5=0 $ , as shown below.
Note: If you do not know how to recognise the region of the inequality, the you can simply choose any point from one side of the line and check whether the coordinates satisfy the inequality. If they do then that region is correct for the given inequality. If not then the correct region is on the other side of the line.
Complete step by step solution:
The given inequality in the question is $ 2y\le x-5 $ .
First write the inequality in the form $ ay+bx+c\le 0 $ , where a is positive.
Then, we get that $ 2y-x+5\le 0 $
To plot the graph of such type of inequality in 2 variables, first draw the graph of the line which we get by replacing the inequality sign by the equality sign.
In this case, we have replaced the ‘ $ \ge $ ’ by ‘=’ sign.
With this, the equation of the line is $ 2y-x+5=0 $ …. (i)
Substitute $ x=0 $ in equation (i) to find the y intercept of the line.
Then,
$ \Rightarrow 2y-0+5=0 $
$ \Rightarrow y=-\dfrac{5}{2} $
Now, substitute $ y=0 $ in equation (i) to find the x intercept of the line.
Then,
$ \Rightarrow 2(0)-x+5=0 $
$ \Rightarrow x=5 $
This means that the x and the y intercepts of the required line are $ \left( 5,0 \right) $ and $ \left( 0,-\dfrac{5}{2} \right) $ respectively.
Now, plot the two points, $ \left( 5,0 \right) $ and $ \left( 0,-\dfrac{5}{2} \right) $ on a cartesian plane and then join the two points by drawing a line, passing through them.
Since in the inequality it is less than or equal to sign, the graph for the inequality is the region below the line $ 2y-x+5=0 $ , as shown below.
Note: If you do not know how to recognise the region of the inequality, the you can simply choose any point from one side of the line and check whether the coordinates satisfy the inequality. If they do then that region is correct for the given inequality. If not then the correct region is on the other side of the line.
Recently Updated Pages
Master Class 8 Social Science: Engaging Questions & Answers for Success
Master Class 8 English: Engaging Questions & Answers for Success
Class 8 Question and Answer - Your Ultimate Solutions Guide
Master Class 8 Maths: Engaging Questions & Answers for Success
Master Class 8 Science: Engaging Questions & Answers for Success
Master Class 7 English: Engaging Questions & Answers for Success
Trending doubts
What is BLO What is the full form of BLO class 8 social science CBSE
Citizens of India can vote at the age of A 18 years class 8 social science CBSE
Full form of STD, ISD and PCO
Convert 40circ C to Fahrenheit A 104circ F B 107circ class 8 maths CBSE
Advantages and disadvantages of science
Right to vote is a AFundamental Right BFundamental class 8 social science CBSE