


How do you graph $ 2x + y = 0 $ ?
Answer
562.2k+ views
Hint: In this question, we need to draw the graph of $ 2x + y = 0 $ . This is the equation of a straight line. For plotting the graph, we need to find 2-3 points on the graph. To find these points, we will be assuming the value of any one variable as constant and then find the value of another variable and hence obtain the point. After getting 2-3 points, we can plot a graph easily.
Complete step by step solution:
Given equation:
$ 2x + y = 0 $ - - - - - - - - (1)
We need to draw a graph for the above equation.
The above equation is of a straight line.
Equation of a straight line
$ y = mx + c $
Where, m is the slope and c is constant.
Now to draw the graph, we need to find 2-3 points on the graph.
Therefore, putting $ y = 0 $ in equation (1), we get
$
\Rightarrow 2x + 0 = 0 \\
\Rightarrow 2x = 0 \\
\Rightarrow x = 0 \;
$
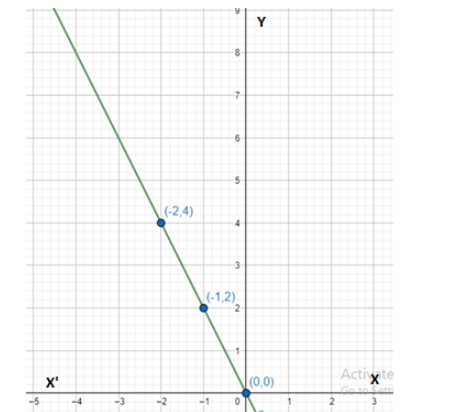
Therefore, our first point is (0, 0).
For $ y = 2 $
Put $ y = 2 $ in equation (1), we get
$
\Rightarrow 2x + 2 = 0 \\
\Rightarrow 2x = - 2 \\
\Rightarrow x = - 1 \;
$
Therefore, our second point is (-1, 2).
For $ y = 4 $
Put $ y = 4 $ in equation (1), we get,
$
\Rightarrow 2x + 4 = 0 \\
\Rightarrow 2x = - 4 \\
\Rightarrow x = - 2 \;
$
Therefore, our third point is (-2, 4).
Hence, we have our three points (0, 0), (-1, 2), (-2, 4) and now we simply need to plot these points on the graph and then connect these points.
Note: X – intercept means the line crosses x – axis at $ y = 0 $ and Y – intercept means the line crosses y – axis at $ x = 0 $ . By finding x – intercept we can find the point which the line crosses when $ y = 0 $ and by finding y – intercept we can find the point which line crosses when $ x = 0 $ .
Complete step by step solution:
Given equation:
$ 2x + y = 0 $ - - - - - - - - (1)
We need to draw a graph for the above equation.
The above equation is of a straight line.
Equation of a straight line
$ y = mx + c $
Where, m is the slope and c is constant.
Now to draw the graph, we need to find 2-3 points on the graph.
Therefore, putting $ y = 0 $ in equation (1), we get
$
\Rightarrow 2x + 0 = 0 \\
\Rightarrow 2x = 0 \\
\Rightarrow x = 0 \;
$
Therefore, our first point is (0, 0).
For $ y = 2 $
Put $ y = 2 $ in equation (1), we get
$
\Rightarrow 2x + 2 = 0 \\
\Rightarrow 2x = - 2 \\
\Rightarrow x = - 1 \;
$
Therefore, our second point is (-1, 2).
For $ y = 4 $
Put $ y = 4 $ in equation (1), we get,
$
\Rightarrow 2x + 4 = 0 \\
\Rightarrow 2x = - 4 \\
\Rightarrow x = - 2 \;
$
Therefore, our third point is (-2, 4).
Hence, we have our three points (0, 0), (-1, 2), (-2, 4) and now we simply need to plot these points on the graph and then connect these points.
Note: X – intercept means the line crosses x – axis at $ y = 0 $ and Y – intercept means the line crosses y – axis at $ x = 0 $ . By finding x – intercept we can find the point which the line crosses when $ y = 0 $ and by finding y – intercept we can find the point which line crosses when $ x = 0 $ .

Recently Updated Pages
Master Class 12 Economics: Engaging Questions & Answers for Success
Master Class 12 English: Engaging Questions & Answers for Success
Master Class 12 Social Science: Engaging Questions & Answers for Success
Master Class 12 Maths: Engaging Questions & Answers for Success
Master Class 12 Physics: Engaging Questions & Answers for Success
Master Class 8 English: Engaging Questions & Answers for Success
Trending doubts
What is BLO What is the full form of BLO class 8 social science CBSE
Which Indian state shares the longest international class 8 social science CBSE
What are the 12 elements of nature class 8 chemistry CBSE
Citizens of India can vote at the age of A 18 years class 8 social science CBSE
Right to vote is a AFundamental Right BFundamental class 8 social science CBSE
Full form of STD, ISD and PCO