


How do you graph $-2x+5y=15$?
Answer
569.4k+ views
Hint: We can simply choose some values of x and find the value of the other variable y for these values of x. Then plot these points on the Cartesian plane to draw the graph. Choose any 2 values of x and find the values of y for those.
Complete step by step solution:
The easiest graph to plot is the graph of a line from the given equation of line.
They can write the given equation as $-2x+5y-15=0$ …. (i)
We can see that the given equation is the general form of the equation of a straight line.
I.e. $ax+by+c=0$, where a, b and c are real numbers.
Therefore, we have confirmed that the given equation is an equation of a straight line. By geometry we know that we need just 2 points that lie on the line to plot the line.
Therefore, let us choose any 2 real values of x and substitute them in equation (i).
Let us choose the 2 values as $x=0$ and $x=1$.
Now, substitute $x=0$ in equation (i).
$\Rightarrow -2(0)+5y-15=0$
$\Rightarrow y=3$
Then, substitute $x=1$ in (i).
$\Rightarrow -2(1)+5y-15=0$
$\Rightarrow y=\dfrac{17}{5}$
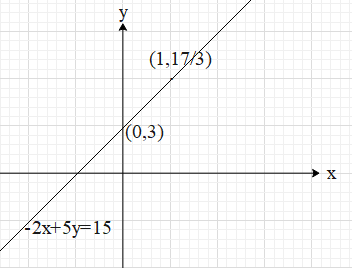
This means that the 2 points on the line are $(0,3)$ and $\left( 1,\dfrac{17}{5} \right)$.
Now, plot these two points on a Cartesian plane and draw the line that connect both the points.
Note: Note that the method of table of values works with an equation of a straight line only. Since a straight line has constant slope we can just find some points and draw the line.
However, other functions with variable slope need much analysis then just some points. We have to check how the function behaves in some intervals. This can be done using continuity and differentiation.
Complete step by step solution:
The easiest graph to plot is the graph of a line from the given equation of line.
They can write the given equation as $-2x+5y-15=0$ …. (i)
We can see that the given equation is the general form of the equation of a straight line.
I.e. $ax+by+c=0$, where a, b and c are real numbers.
Therefore, we have confirmed that the given equation is an equation of a straight line. By geometry we know that we need just 2 points that lie on the line to plot the line.
Therefore, let us choose any 2 real values of x and substitute them in equation (i).
Let us choose the 2 values as $x=0$ and $x=1$.
Now, substitute $x=0$ in equation (i).
$\Rightarrow -2(0)+5y-15=0$
$\Rightarrow y=3$
Then, substitute $x=1$ in (i).
$\Rightarrow -2(1)+5y-15=0$
$\Rightarrow y=\dfrac{17}{5}$
This means that the 2 points on the line are $(0,3)$ and $\left( 1,\dfrac{17}{5} \right)$.
Now, plot these two points on a Cartesian plane and draw the line that connect both the points.
Note: Note that the method of table of values works with an equation of a straight line only. Since a straight line has constant slope we can just find some points and draw the line.
However, other functions with variable slope need much analysis then just some points. We have to check how the function behaves in some intervals. This can be done using continuity and differentiation.
Recently Updated Pages
Master Class 11 Social Science: Engaging Questions & Answers for Success
Master Class 11 English: Engaging Questions & Answers for Success
Master Class 11 Maths: Engaging Questions & Answers for Success
Master Class 11 Chemistry: Engaging Questions & Answers for Success
Master Class 11 Biology: Engaging Questions & Answers for Success
Master Class 11 Physics: Engaging Questions & Answers for Success
Trending doubts
Differentiate between an exothermic and an endothermic class 11 chemistry CBSE
One Metric ton is equal to kg A 10000 B 1000 C 100 class 11 physics CBSE
Difference Between Prokaryotic Cells and Eukaryotic Cells
There are 720 permutations of the digits 1 2 3 4 5 class 11 maths CBSE
Draw a diagram of a plant cell and label at least eight class 11 biology CBSE
Two of the body parts which do not appear in MRI are class 11 biology CBSE