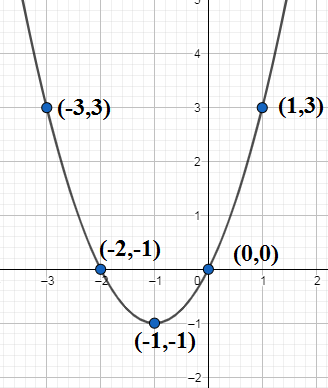
How do you draw the graph $y={{x}^{2}}+2x$?
Answer
565.2k+ views
Hint: We find the $x-$intercepts of the curve by putting $y=0$ and we find $y-$intercept by putting $x=0$. We find the minimum value of the curve by making it a complete square. We take a minimum 5 points and join them with a free hand to get the plot.
Complete step-by-step solution:
We know that the graph of a function is the locus of points $\left( x,y \right)$ such that $y=f\left( x \right)$ where $x,y$ are real numbers. We are given the following quadratic polynomial function
\[y={{x}^{2}}+2x\]
So let us put $y=$ and find the $x-$intercept . We have
\[\begin{align}
& 0={{x}^{2}}+2x \\
& \Rightarrow x\left( x+2 \right)=0 \\
& \Rightarrow x=0\text{ or }x=-2 \\
\end{align}\]
So we find that $y=0$ at $x=0,-2$ .It means the curve cuts $x-$axis at $\left( -2,0 \right),\left( 0,0 \right)$.Let us put $x=0$ in the curve to have;
\[y={{0}^{2}}+2\cdot 0=0\]
So there is no $y-$intercept of the curve. We know that all quadratic functions of the type $y=a{{x}^{2}}+bx+c$ have minimum values but not maximum. So let us complete square in $x$ to have;
\[\begin{align}
& y={{x}^{2}}+2x \\
& \Rightarrow y={{x}^{2}}+2x+1-1 \\
& \Rightarrow y={{\left( x+1 \right)}^{2}}-1 \\
\end{align}\]
Since square is always non-negative we have ${{\left( x+1 \right)}^{2}}\ge 0$, then we have
\[\begin{align}
& \Rightarrow y={{\left( x+1 \right)}^{2}}-1\ge -1 \\
& \Rightarrow y\ge -1 \\
\end{align}\]
So the minimum value of $y=-1$ and the minimum value occurs when ${{\left( x+1 \right)}^{2}}=0$ or $x=-1$. We have already three points for the curve $\left( -2,0 \right),\left( -1,1 \right),\left( 0,0 \right)$. We find $y$ for two more points at $x=-3,x=1$ to have
\[\begin{align}
& y\left( -3 \right)={{\left( -3 \right)}^{2}}+2\left( -3 \right)=3 \\
& y\left( 1 \right)={{1}^{2}}+2\cdot 1=3 \\
\end{align}\]
So we draw the table for $x$ and $y$.
We plot the above points and join them to have the graph as

Note: We note that the obtained graph is the graph of upward parabola whose general equation is given by $y=a{{x}^{2}}+bx+c$ with the condition $a>0$ whose vertex here is $\left( -1,-1 \right)$.We can directly find the minimum value of $y={{x}^{2}}+2x$ by finding $y$ at $x=\dfrac{-b}{2a}$. If $a<0$ we the equation $y=a{{x}^{2}}+bx+c$ represents a downward parabola. We also note that the obtained curve is symmetric about the line $x=-1$.
Complete step-by-step solution:
We know that the graph of a function is the locus of points $\left( x,y \right)$ such that $y=f\left( x \right)$ where $x,y$ are real numbers. We are given the following quadratic polynomial function
\[y={{x}^{2}}+2x\]
So let us put $y=$ and find the $x-$intercept . We have
\[\begin{align}
& 0={{x}^{2}}+2x \\
& \Rightarrow x\left( x+2 \right)=0 \\
& \Rightarrow x=0\text{ or }x=-2 \\
\end{align}\]
So we find that $y=0$ at $x=0,-2$ .It means the curve cuts $x-$axis at $\left( -2,0 \right),\left( 0,0 \right)$.Let us put $x=0$ in the curve to have;
\[y={{0}^{2}}+2\cdot 0=0\]
So there is no $y-$intercept of the curve. We know that all quadratic functions of the type $y=a{{x}^{2}}+bx+c$ have minimum values but not maximum. So let us complete square in $x$ to have;
\[\begin{align}
& y={{x}^{2}}+2x \\
& \Rightarrow y={{x}^{2}}+2x+1-1 \\
& \Rightarrow y={{\left( x+1 \right)}^{2}}-1 \\
\end{align}\]
Since square is always non-negative we have ${{\left( x+1 \right)}^{2}}\ge 0$, then we have
\[\begin{align}
& \Rightarrow y={{\left( x+1 \right)}^{2}}-1\ge -1 \\
& \Rightarrow y\ge -1 \\
\end{align}\]
So the minimum value of $y=-1$ and the minimum value occurs when ${{\left( x+1 \right)}^{2}}=0$ or $x=-1$. We have already three points for the curve $\left( -2,0 \right),\left( -1,1 \right),\left( 0,0 \right)$. We find $y$ for two more points at $x=-3,x=1$ to have
\[\begin{align}
& y\left( -3 \right)={{\left( -3 \right)}^{2}}+2\left( -3 \right)=3 \\
& y\left( 1 \right)={{1}^{2}}+2\cdot 1=3 \\
\end{align}\]
So we draw the table for $x$ and $y$.
| $x$ | $y$ |
| $-3$ | 3 |
| $-2$ | 0 |
| $-1$ | $-1$ |
| 0 | 0 |
| 1 | 1 |
We plot the above points and join them to have the graph as

Note: We note that the obtained graph is the graph of upward parabola whose general equation is given by $y=a{{x}^{2}}+bx+c$ with the condition $a>0$ whose vertex here is $\left( -1,-1 \right)$.We can directly find the minimum value of $y={{x}^{2}}+2x$ by finding $y$ at $x=\dfrac{-b}{2a}$. If $a<0$ we the equation $y=a{{x}^{2}}+bx+c$ represents a downward parabola. We also note that the obtained curve is symmetric about the line $x=-1$.
Recently Updated Pages
Master Class 11 Computer Science: Engaging Questions & Answers for Success

Master Class 11 Business Studies: Engaging Questions & Answers for Success

Master Class 11 Economics: Engaging Questions & Answers for Success

Master Class 11 English: Engaging Questions & Answers for Success

Master Class 11 Maths: Engaging Questions & Answers for Success

Master Class 11 Biology: Engaging Questions & Answers for Success

Trending doubts
One Metric ton is equal to kg A 10000 B 1000 C 100 class 11 physics CBSE

There are 720 permutations of the digits 1 2 3 4 5 class 11 maths CBSE

Discuss the various forms of bacteria class 11 biology CBSE

Draw a diagram of a plant cell and label at least eight class 11 biology CBSE

State the laws of reflection of light

Explain zero factorial class 11 maths CBSE


