


How do you draw the graph of \[y=x-3\] ?
Answer
601.2k+ views
Hint:
For drawing the graph of a linear equation, we just need to plot two points satisfying the given linear equation. This can be done by randomly selecting $2$ values for x and find the values of y corresponding to the selected values of x.
Complete step by step solution:
First, to solve such types of questions, we need to draw the x-axis and the y-axis on the graph. The x-axis is simply the horizontal axis in the graph and the y-axis is the vertical one
To draw the graph of \[y=x-3\] , we need to find the points which lie on \[y=x-3\] .
In the graph of \[y=x-3\] :
On putting, \[x=0\],
We get, \[y=0-3=(-3)\] .
Therefore, the point \[(0,-3)\] will lie on the graph.
Now, on putting, \[y=0\] ,
We get, \[0=x-3\Rightarrow x=3\] .
Therefore, the point \[(3,0)\] will lie on the graph.
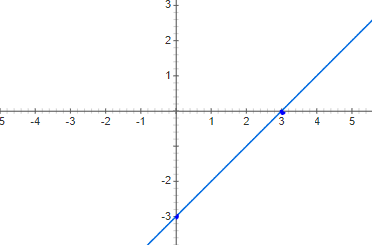
From the above calculations, we found that the graph will include \[(3,0)\] and \[(0,-3)\] .
Now, let’s plot these points in the graph:
Note:
While solving such questions, it is recommended to select points for which one of the coordinates is $0$. This will help in simplifying the calculations. Graph of a linear equation is a straight line, therefore, finding only $2$ points is sufficient.
For drawing the graph of a linear equation, we just need to plot two points satisfying the given linear equation. This can be done by randomly selecting $2$ values for x and find the values of y corresponding to the selected values of x.
Complete step by step solution:
First, to solve such types of questions, we need to draw the x-axis and the y-axis on the graph. The x-axis is simply the horizontal axis in the graph and the y-axis is the vertical one
To draw the graph of \[y=x-3\] , we need to find the points which lie on \[y=x-3\] .
In the graph of \[y=x-3\] :
On putting, \[x=0\],
We get, \[y=0-3=(-3)\] .
Therefore, the point \[(0,-3)\] will lie on the graph.
Now, on putting, \[y=0\] ,
We get, \[0=x-3\Rightarrow x=3\] .
Therefore, the point \[(3,0)\] will lie on the graph.
From the above calculations, we found that the graph will include \[(3,0)\] and \[(0,-3)\] .
Now, let’s plot these points in the graph:
Note:
While solving such questions, it is recommended to select points for which one of the coordinates is $0$. This will help in simplifying the calculations. Graph of a linear equation is a straight line, therefore, finding only $2$ points is sufficient.
Recently Updated Pages
Master Class 11 English: Engaging Questions & Answers for Success
Master Class 11 Social Science: Engaging Questions & Answers for Success
Master Class 11 Maths: Engaging Questions & Answers for Success
Master Class 11 Biology: Engaging Questions & Answers for Success
Master Class 11 Physics: Engaging Questions & Answers for Success
Master Class 11 Chemistry: Engaging Questions & Answers for Success
Trending doubts
Explain the Treaty of Vienna of 1815 class 10 social science CBSE
What is the Total Duration of Football Match?
First Cotton Mill of India
In which year voting age was reduced from 21 to 18?
10 examples of evaporation in daily life with explanations
What planets have no moons Which one has only one moon class 10 physics CBSE