


How can you graph $r = 4\cos \theta $?
Answer
606.9k+ views
Hint: For making any graph, you need to place the values of the dependent variable which in this case is $\theta $ and then find the value of the independent variable which here is r and then put it on the graph. Also, the variation of $\theta $ happens in degrees.
Complete step by step solution:
To solve this question, first, we need to make a chart of the function and its parts.
Here, the things noteworthy are that all values of $\theta $ are in degrees and the values of $\cos \theta $ are calculated in accordance. Now, to find the values of r, we do nothing but multiply the values of $\cos \theta $ by 4. For example, the value of r at $\theta $ at 45 degrees is
$\
r = 4\cos \theta \\
= 4\cos 45^\circ \\
= 4 \times \dfrac{1}{{\sqrt 2 }} \\
= 2\sqrt 2 \\
\ $
All other values of r can be found out similarly.
Now, let’s plot the graph. For this, we need a graph sheet which shall be marked out in an appropriate proportion. For this, take one box on the X-axis to represent 45 degrees and take one box on the Y-axis to represent 1 unit. After doing this, see through the chart above and place the values in. The X-axis here represents degrees whereas Y-axis represents the value of r where $r = 4\cos \theta $.
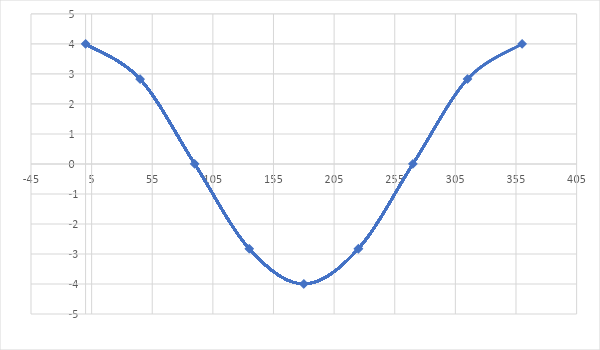
After reaching 360 degrees, the graph will repeat itself in the same way that it had started where 405 degrees will have the same value as 45 degrees, 450 degrees will have a value equal to 90 degrees, and so on.
Note:
Adding extra variables will increase the data and nothing more so taking values like 30 degrees or 60 degrees or 120 degrees will be just more work and nothing else. Even taking the values of 45 degrees, 135 degrees, 225 degrees, and 315 degrees is just for practice. Just remember the way in which the graph flows and you can work with the multiples of 90 degrees because only they provide the peak values.
Complete step by step solution:
To solve this question, first, we need to make a chart of the function and its parts.
| $\theta $ | 0 | 45 | 90 | 135 | 180 | 225 | 270 | 315 | 360 |
| $\cos \theta $ | 1 | $\dfrac{1}{{\sqrt 2 }}$ | 0 | $ - \dfrac{1}{{\sqrt 2 }}$ | -1 | $ - \dfrac{1}{{\sqrt 2 }}$ | 0 | $\dfrac{1}{{\sqrt 2 }}$ | 1 |
| $r = 4\cos \theta $ | 4 | $2\sqrt 2 $ | 0 | $ - 2\sqrt 2 $ | -4 | $ - 2\sqrt 2 $ | 0 | $2\sqrt 2 $ | 4 |
Here, the things noteworthy are that all values of $\theta $ are in degrees and the values of $\cos \theta $ are calculated in accordance. Now, to find the values of r, we do nothing but multiply the values of $\cos \theta $ by 4. For example, the value of r at $\theta $ at 45 degrees is
$\
r = 4\cos \theta \\
= 4\cos 45^\circ \\
= 4 \times \dfrac{1}{{\sqrt 2 }} \\
= 2\sqrt 2 \\
\ $
All other values of r can be found out similarly.
Now, let’s plot the graph. For this, we need a graph sheet which shall be marked out in an appropriate proportion. For this, take one box on the X-axis to represent 45 degrees and take one box on the Y-axis to represent 1 unit. After doing this, see through the chart above and place the values in. The X-axis here represents degrees whereas Y-axis represents the value of r where $r = 4\cos \theta $.
After reaching 360 degrees, the graph will repeat itself in the same way that it had started where 405 degrees will have the same value as 45 degrees, 450 degrees will have a value equal to 90 degrees, and so on.
Note:
Adding extra variables will increase the data and nothing more so taking values like 30 degrees or 60 degrees or 120 degrees will be just more work and nothing else. Even taking the values of 45 degrees, 135 degrees, 225 degrees, and 315 degrees is just for practice. Just remember the way in which the graph flows and you can work with the multiples of 90 degrees because only they provide the peak values.
Recently Updated Pages
Master Class 11 English: Engaging Questions & Answers for Success
Master Class 11 Physics: Engaging Questions & Answers for Success
Master Class 11 Computer Science: Engaging Questions & Answers for Success
Master Class 11 Chemistry: Engaging Questions & Answers for Success
Master Class 11 Social Science: Engaging Questions & Answers for Success
Master Class 11 Accountancy: Engaging Questions & Answers for Success
Trending doubts
Draw a diagram of a plant cell and label at least eight class 11 biology CBSE
Proton was discovered by A Thomson B Rutherford C Chadwick class 11 chemistry CBSE
What is the purity of pure gold in carat class 11 chemistry CBSE
Can anyone list 10 advantages and disadvantages of friction
Lysosomes are known as suicidal bags of cell why class 11 biology CBSE
Derive the equation of motion by the calculus method class 11 physics CBSE