


How can I read distance-time graphs?
Answer
575.4k+ views
Hint: The distance time graph represents the motion of the object/body in terms of direction and the slope of this graph givens the value of the speed of the object/body. The x-axis represents the time taken and the y-axis represents the distance covered.
Formula used:
\[s=\dfrac{d}{t}\]
Complete answer:
The formula that relates the parameters of the motion, such as, the distance and time is given as follows.
\[s=\dfrac{d}{t}\]
Where s is the speed, d is the distance and t is the time.
The distance represents how far the object/body moves and time represents the time taken by the object/body to cover the distance.
The distance time graph represents the motion of the object/body in terms of direction. Consider, in case, if the graph is steep, then, the motion of the object/body is increasing at a constant rate. If the graph is a straight line parallel to the time axis, then the motion is said to be constant. In case, the graph is increasing exponentially, then, the speed is increasing. A downward directed graph represents the decreasing speed. The uniform motion of the body/object is represented by a straight line.
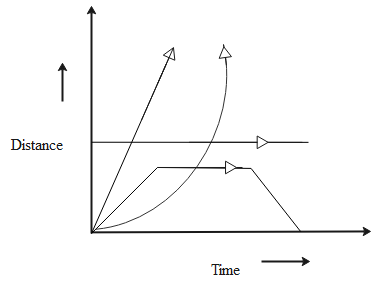
In the above graph, the units of the parameter time can be, seconds, minutes or hours and the units of the parameter distance can be, cm, meters, kilometre, etc.
\[\therefore \]The distance time graph represents the speed of the object/body.
Note:
The different forms of distance time graph, that is, a steep line, exponentially increasing and decreasing lines, a horizontal line, a vertical line, represents the different forms of the motion of object/body.
Formula used:
\[s=\dfrac{d}{t}\]
Complete answer:
The formula that relates the parameters of the motion, such as, the distance and time is given as follows.
\[s=\dfrac{d}{t}\]
Where s is the speed, d is the distance and t is the time.
The distance represents how far the object/body moves and time represents the time taken by the object/body to cover the distance.
The distance time graph represents the motion of the object/body in terms of direction. Consider, in case, if the graph is steep, then, the motion of the object/body is increasing at a constant rate. If the graph is a straight line parallel to the time axis, then the motion is said to be constant. In case, the graph is increasing exponentially, then, the speed is increasing. A downward directed graph represents the decreasing speed. The uniform motion of the body/object is represented by a straight line.
In the above graph, the units of the parameter time can be, seconds, minutes or hours and the units of the parameter distance can be, cm, meters, kilometre, etc.
\[\therefore \]The distance time graph represents the speed of the object/body.
Note:
The different forms of distance time graph, that is, a steep line, exponentially increasing and decreasing lines, a horizontal line, a vertical line, represents the different forms of the motion of object/body.
Recently Updated Pages
Master Class 12 Economics: Engaging Questions & Answers for Success
Master Class 12 English: Engaging Questions & Answers for Success
Master Class 12 Social Science: Engaging Questions & Answers for Success
Master Class 12 Maths: Engaging Questions & Answers for Success
Master Class 12 Physics: Engaging Questions & Answers for Success
Master Class 9 General Knowledge: Engaging Questions & Answers for Success
Trending doubts
Explain the Treaty of Vienna of 1815 class 10 social science CBSE
Why is it 530 pm in india when it is 1200 afternoon class 10 social science CBSE
What is the full form of POSCO class 10 social science CBSE
Define Potential, Developed, Stock and Reserved resources
The speaker of the Lok Sabha is elected by the APresident class 10 social science CBSE
Complete the sentence with the most appropriate word class 10 english CBSE