


How do you graph \[y=\tan \left( \dfrac{x}{3} \right)\] and include two full periods?
Answer
574.2k+ views
Hint: In the given question, we have been asked to graph \[y=\tan \left( \dfrac{x}{3} \right)\] and include two full periods. In order to solve the question, we will take the general equation and find the period. The general equation of \[y=\tan \left( \dfrac{x}{3} \right)\] will be \[y=a\tan \left( b\left( x+c \right) \right)+d\] and the period is given by \[\dfrac{\pi }{\left| b \right|}\] .
We will equate the given equation with the general equation and find the solution.
Complete step-by-step answer:
We have given that,
\[y=\tan \left( \dfrac{x}{3} \right)\]
Finding the asymptote:
Vertical asymptote;
For any \[y=\tan x\] , vertical asymptote occurs at \[x=\dfrac{\pi }{2}+n\pi \] , where ‘n’ is an integer. Using the basic period for \[y=\tan x,\left( -\dfrac{\pi }{2},\dfrac{\pi }{2} \right)\] .
The general equation of \[y=\tan \left( \dfrac{x}{3} \right)\] will be \[y=a\tan \left( b\left( x+c \right) \right)+d\]
Therefore,
The vertical asymptote for \[y=\tan \left( \dfrac{x}{3} \right)\] .
\[\left( \dfrac{x}{3} \right)=-\dfrac{\pi }{2}\ \ or\ \ \left( \dfrac{x}{3} \right)=\dfrac{\pi }{2}\]
Solving for the value of ‘x’, we will get
\[x=-\dfrac{3\pi }{2},\dfrac{3\pi }{2}\]
Therefore,
The basic period for \[y=\tan \left( \dfrac{x}{3} \right)\] will occur at \[\left( -\dfrac{3\pi }{2},\dfrac{3\pi }{2} \right)\] .
No horizontal and oblique asymptote occurs as tangent function can only have vertical asymptote.
Finding the period: \[\dfrac{\pi }{\left| b \right|}\]
As we know that,
\[\dfrac{1}{3}\] is approximately equal to \[0.\overline{3}\] which is positive so eliminating the absolute value.
Therefore,
Period = \[\dfrac{\pi }{\dfrac{1}{3}}\] = \[3\pi \]
And it is given in the question that \[y=\tan \left( \dfrac{x}{3} \right)\] and include two full periods.
Thus,
\[2\times 3\pi =6\pi \]
Now,
Amplitude of \[y=\tan \left( \dfrac{x}{3} \right)\] :
Since the graph of the tangent function is not maximum and the minimum value, thus no amplitude.
Shift of \[y=\tan \left( \dfrac{x}{3} \right)\] :
The shift has two parts. One being the phase shift of the graph and one being vertical shift.
There will be no phase shift and the vertical shift.
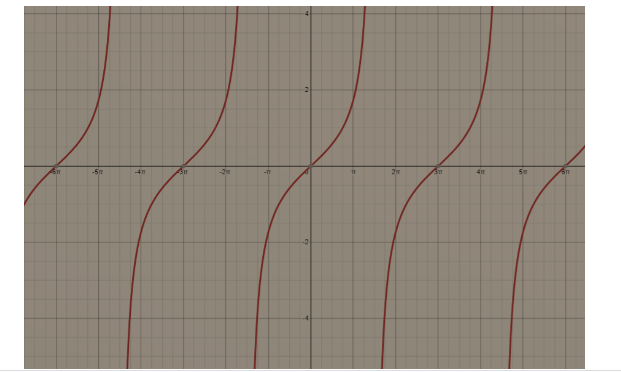
Hence, the graph of the \[y=\tan \left( \dfrac{x}{3} \right)\] is as follows;
Note: Amplitude is the vertical distance from the x-axis to the highest or the lowest point on a sine or cosine curve. Period of each generalized trigonometric function curve is the length of the one complete cycle. Phase shift is the amount that the curve is shifted to the left or the right. Amplitude and period are always the positive number whereas phase shift can be of both the signs.
We will equate the given equation with the general equation and find the solution.
Complete step-by-step answer:
We have given that,
\[y=\tan \left( \dfrac{x}{3} \right)\]
Finding the asymptote:
Vertical asymptote;
For any \[y=\tan x\] , vertical asymptote occurs at \[x=\dfrac{\pi }{2}+n\pi \] , where ‘n’ is an integer. Using the basic period for \[y=\tan x,\left( -\dfrac{\pi }{2},\dfrac{\pi }{2} \right)\] .
The general equation of \[y=\tan \left( \dfrac{x}{3} \right)\] will be \[y=a\tan \left( b\left( x+c \right) \right)+d\]
Therefore,
The vertical asymptote for \[y=\tan \left( \dfrac{x}{3} \right)\] .
\[\left( \dfrac{x}{3} \right)=-\dfrac{\pi }{2}\ \ or\ \ \left( \dfrac{x}{3} \right)=\dfrac{\pi }{2}\]
Solving for the value of ‘x’, we will get
\[x=-\dfrac{3\pi }{2},\dfrac{3\pi }{2}\]
Therefore,
The basic period for \[y=\tan \left( \dfrac{x}{3} \right)\] will occur at \[\left( -\dfrac{3\pi }{2},\dfrac{3\pi }{2} \right)\] .
No horizontal and oblique asymptote occurs as tangent function can only have vertical asymptote.
Finding the period: \[\dfrac{\pi }{\left| b \right|}\]
As we know that,
\[\dfrac{1}{3}\] is approximately equal to \[0.\overline{3}\] which is positive so eliminating the absolute value.
Therefore,
Period = \[\dfrac{\pi }{\dfrac{1}{3}}\] = \[3\pi \]
And it is given in the question that \[y=\tan \left( \dfrac{x}{3} \right)\] and include two full periods.
Thus,
\[2\times 3\pi =6\pi \]
Now,
Amplitude of \[y=\tan \left( \dfrac{x}{3} \right)\] :
Since the graph of the tangent function is not maximum and the minimum value, thus no amplitude.
Shift of \[y=\tan \left( \dfrac{x}{3} \right)\] :
The shift has two parts. One being the phase shift of the graph and one being vertical shift.
There will be no phase shift and the vertical shift.
Hence, the graph of the \[y=\tan \left( \dfrac{x}{3} \right)\] is as follows;
Note: Amplitude is the vertical distance from the x-axis to the highest or the lowest point on a sine or cosine curve. Period of each generalized trigonometric function curve is the length of the one complete cycle. Phase shift is the amount that the curve is shifted to the left or the right. Amplitude and period are always the positive number whereas phase shift can be of both the signs.
Recently Updated Pages
Master Class 12 Economics: Engaging Questions & Answers for Success
Master Class 12 English: Engaging Questions & Answers for Success
Master Class 12 Social Science: Engaging Questions & Answers for Success
Master Class 12 Maths: Engaging Questions & Answers for Success
Master Class 12 Physics: Engaging Questions & Answers for Success
Master Class 9 General Knowledge: Engaging Questions & Answers for Success
Trending doubts
One Metric ton is equal to kg A 10000 B 1000 C 100 class 11 physics CBSE
Difference Between Prokaryotic Cells and Eukaryotic Cells
Two of the body parts which do not appear in MRI are class 11 biology CBSE
Find the value of the expression given below sin 30circ class 11 maths CBSE
1 ton equals to A 100 kg B 1000 kg C 10 kg D 10000 class 11 physics CBSE
Draw a diagram of nephron and explain its structur class 11 biology CBSE