


How do you graph $y=\sin \left( \dfrac{1}{3}x \right)$ ?
Answer
607.5k+ views
Hint: In order to graph any function, we must know an ample number of points on it in order to trace it through them. Some of which are the stationary and critical points and the points of inflection. Inflection points are those where the second derivative of the graph is zero. We must also know the intervals between the critical and inflection point and whether the function is increasing or decreasing in these intervals.
Complete step-by-step answer:
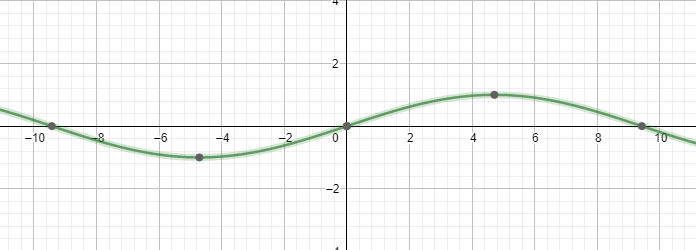
For the function $f\left( x \right)=\sin \left( \dfrac{1}{3}x \right)$, the amplitude of this function remains the same, that is, 1 but the period changes.
For any sinusoidal function, $f\left( x \right)=A\sin Bx$, $A$ represents the amplitude of sine function and $\dfrac{2\pi }{B}$ represents the period of the sine function.
Since $B=\dfrac{1}{3}$, therefore, for $f\left( x \right)=\sin \left( \dfrac{1}{3}x \right)$, the period is equal to $\dfrac{2\pi }{\dfrac{1}{3}}=6\pi $. Thus, the graph starts repeating itself after $6\pi $.
Let us take five points in one period on this graph now.
$\begin{align}
& {{x}_{1}}=0 \\
& {{x}_{2}}=\dfrac{3\pi }{2} \\
& {{x}_{3}}=3\pi \\
& {{x}_{4}}=\dfrac{9\pi }{2} \\
\end{align}$
${{x}_{5}}=6\pi $
Now, put the x-coordinate of these points in the function $y=\sin \left( \dfrac{1}{3}x \right)$ to find the y-coordinate of the points.
When ${{x}_{1}}=0,$ ${{y}_{1}}=\sin \left( \dfrac{1}{3}.0 \right)=\sin 0=0$
When ${{x}_{2}}=\dfrac{3\pi }{2},$ ${{y}_{2}}=\sin \left( \dfrac{1}{3}.\dfrac{3\pi }{2} \right)=\sin \dfrac{\pi }{2}=1$
When ${{x}_{3}}=3\pi ,$ ${{y}_{3}}=\sin \left( \dfrac{1}{3}.3\pi \right)=\sin \pi =0$
When ${{x}_{4}}=\dfrac{9\pi }{2},$ ${{y}_{4}}=\sin \left( \dfrac{1}{3}.\dfrac{9\pi }{2} \right)=\sin \dfrac{3\pi }{2}=-1$
When ${{x}_{5}}=6\pi ,$ ${{y}_{5}}=\sin \left( \dfrac{1}{3}.6\pi \right)=\sin 2\pi =0$
Therefore, the points are $\left( 0,0 \right),\left( \dfrac{3\pi }{2},1 \right),\left( 3\pi ,0 \right),\left( \dfrac{9\pi }{2},-1 \right)$ and $\left( 6\pi ,0 \right)$.
These points are sufficient to draw the graph of the given function.
Note:
The graph of $\sin x$ is very well known to us. It is a periodic function with a period of $2\pi $. The amplitude of this function is 1, that is, the range of the function lies in $\left[ -1,1 \right]$ and the domain of the function is all real numbers, $R$.
Complete step-by-step answer:
For the function $f\left( x \right)=\sin \left( \dfrac{1}{3}x \right)$, the amplitude of this function remains the same, that is, 1 but the period changes.
For any sinusoidal function, $f\left( x \right)=A\sin Bx$, $A$ represents the amplitude of sine function and $\dfrac{2\pi }{B}$ represents the period of the sine function.
Since $B=\dfrac{1}{3}$, therefore, for $f\left( x \right)=\sin \left( \dfrac{1}{3}x \right)$, the period is equal to $\dfrac{2\pi }{\dfrac{1}{3}}=6\pi $. Thus, the graph starts repeating itself after $6\pi $.
Let us take five points in one period on this graph now.
$\begin{align}
& {{x}_{1}}=0 \\
& {{x}_{2}}=\dfrac{3\pi }{2} \\
& {{x}_{3}}=3\pi \\
& {{x}_{4}}=\dfrac{9\pi }{2} \\
\end{align}$
${{x}_{5}}=6\pi $
Now, put the x-coordinate of these points in the function $y=\sin \left( \dfrac{1}{3}x \right)$ to find the y-coordinate of the points.
When ${{x}_{1}}=0,$ ${{y}_{1}}=\sin \left( \dfrac{1}{3}.0 \right)=\sin 0=0$
When ${{x}_{2}}=\dfrac{3\pi }{2},$ ${{y}_{2}}=\sin \left( \dfrac{1}{3}.\dfrac{3\pi }{2} \right)=\sin \dfrac{\pi }{2}=1$
When ${{x}_{3}}=3\pi ,$ ${{y}_{3}}=\sin \left( \dfrac{1}{3}.3\pi \right)=\sin \pi =0$
When ${{x}_{4}}=\dfrac{9\pi }{2},$ ${{y}_{4}}=\sin \left( \dfrac{1}{3}.\dfrac{9\pi }{2} \right)=\sin \dfrac{3\pi }{2}=-1$
When ${{x}_{5}}=6\pi ,$ ${{y}_{5}}=\sin \left( \dfrac{1}{3}.6\pi \right)=\sin 2\pi =0$
Therefore, the points are $\left( 0,0 \right),\left( \dfrac{3\pi }{2},1 \right),\left( 3\pi ,0 \right),\left( \dfrac{9\pi }{2},-1 \right)$ and $\left( 6\pi ,0 \right)$.
These points are sufficient to draw the graph of the given function.
Note:
The graph of $\sin x$ is very well known to us. It is a periodic function with a period of $2\pi $. The amplitude of this function is 1, that is, the range of the function lies in $\left[ -1,1 \right]$ and the domain of the function is all real numbers, $R$.
Recently Updated Pages
Master Class 11 English: Engaging Questions & Answers for Success
Master Class 11 Physics: Engaging Questions & Answers for Success
Master Class 11 Computer Science: Engaging Questions & Answers for Success
Master Class 11 Chemistry: Engaging Questions & Answers for Success
Master Class 11 Social Science: Engaging Questions & Answers for Success
Master Class 11 Accountancy: Engaging Questions & Answers for Success
Trending doubts
Draw a diagram of a plant cell and label at least eight class 11 biology CBSE
Proton was discovered by A Thomson B Rutherford C Chadwick class 11 chemistry CBSE
What is the purity of pure gold in carat class 11 chemistry CBSE
Can anyone list 10 advantages and disadvantages of friction
Lysosomes are known as suicidal bags of cell why class 11 biology CBSE
Derive the equation of motion by the calculus method class 11 physics CBSE