


How do you graph $y=-\dfrac{4}{3}x+1$ using the slope and intercept?
Answer
556.8k+ views
Hint: At first, we compare the given equation with the slope-intercept form of a straight line and find out the slope and $y-\text{intercept}$ . Then we plot the point $\left( 0,1 \right)$ and draw another line through this point making an angle \[{{\tan }^{-1}}\left( -\dfrac{4}{3} \right)\] with the $x-axis$ . This is the required line.
Complete step by step answer:
The given equation of the line is:
$y=-\dfrac{4}{3}x+1$
Comparing it with the general equation of a straight line in slope-intercept form $y=mx+c$ , where $m$ is the slope of the line and $c$ is the $y-\text{intercept}$ , we get
$m=-\dfrac{4}{3}$ and $c=1$
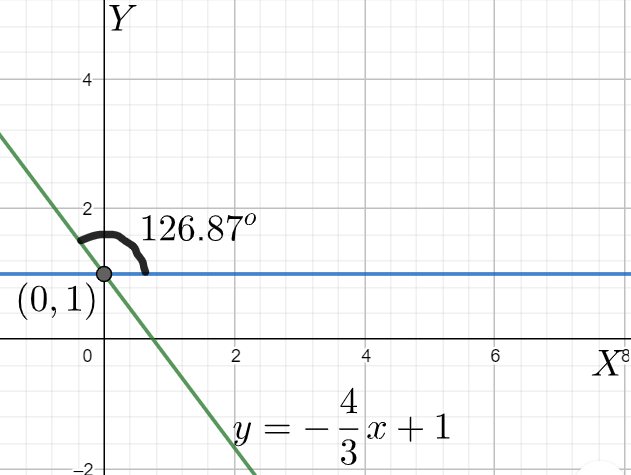
$y-\text{intercept}$ means that the point where the line intersects the $y-axis$ is $\left( 0,c \right)$ . As, in this problem, $c=1$ , the point where the given line cuts the $y-axis$ is $\left( 0,1 \right)$ . We therefore plot this point on the graph paper.
Slope of a line means the tangent of the angle that the line makes with the positive $x-axis$ . If we are given the slope of a line, then we can find out the angle that it makes with the $x-axis$ by the formula,
$\theta ={{\tan }^{-1}}m....formula1$
We now draw a line parallel to $x-axis$ through the point $\left( 0,1 \right)$ . The angle that the given line makes with the $x-axis$ is given by $formula1$ as
\[\begin{align}
& \theta ={{\tan }^{-1}}\left( -\dfrac{4}{3} \right) \\
& \Rightarrow \theta ={{126.87}^{\circ }} \\
\end{align}\]
We draw another line making an angle \[{{126.87}^{\circ }}\] in clockwise direction with the parallel line that was previously drawn through the point $\left( 0,1 \right)$ .
Therefore, we can conclude that the final line drawn at the specified angle passing through the point $\left( 0,1 \right)$ with the parallel line is nothing but the required line in the problem.
Note:
The line parallel to $x-axis$ must be drawn at first to simplify the graph plot. The slope of the line being given, we must remember to find out the angle that the line must make with the $x-axis$ . Students often forget to find out the angle and mistakenly consider the slope to be the angle and end up with the wrong graph.
Complete step by step answer:
The given equation of the line is:
$y=-\dfrac{4}{3}x+1$
Comparing it with the general equation of a straight line in slope-intercept form $y=mx+c$ , where $m$ is the slope of the line and $c$ is the $y-\text{intercept}$ , we get
$m=-\dfrac{4}{3}$ and $c=1$
$y-\text{intercept}$ means that the point where the line intersects the $y-axis$ is $\left( 0,c \right)$ . As, in this problem, $c=1$ , the point where the given line cuts the $y-axis$ is $\left( 0,1 \right)$ . We therefore plot this point on the graph paper.
Slope of a line means the tangent of the angle that the line makes with the positive $x-axis$ . If we are given the slope of a line, then we can find out the angle that it makes with the $x-axis$ by the formula,
$\theta ={{\tan }^{-1}}m....formula1$
We now draw a line parallel to $x-axis$ through the point $\left( 0,1 \right)$ . The angle that the given line makes with the $x-axis$ is given by $formula1$ as
\[\begin{align}
& \theta ={{\tan }^{-1}}\left( -\dfrac{4}{3} \right) \\
& \Rightarrow \theta ={{126.87}^{\circ }} \\
\end{align}\]
We draw another line making an angle \[{{126.87}^{\circ }}\] in clockwise direction with the parallel line that was previously drawn through the point $\left( 0,1 \right)$ .
Therefore, we can conclude that the final line drawn at the specified angle passing through the point $\left( 0,1 \right)$ with the parallel line is nothing but the required line in the problem.
Note:
The line parallel to $x-axis$ must be drawn at first to simplify the graph plot. The slope of the line being given, we must remember to find out the angle that the line must make with the $x-axis$ . Students often forget to find out the angle and mistakenly consider the slope to be the angle and end up with the wrong graph.
Recently Updated Pages
Master Class 11 Computer Science: Engaging Questions & Answers for Success
Master Class 11 Business Studies: Engaging Questions & Answers for Success
Master Class 11 Economics: Engaging Questions & Answers for Success
Master Class 11 English: Engaging Questions & Answers for Success
Master Class 11 Maths: Engaging Questions & Answers for Success
Master Class 11 Biology: Engaging Questions & Answers for Success
Trending doubts
One Metric ton is equal to kg A 10000 B 1000 C 100 class 11 physics CBSE
There are 720 permutations of the digits 1 2 3 4 5 class 11 maths CBSE
Discuss the various forms of bacteria class 11 biology CBSE
Draw a diagram of a plant cell and label at least eight class 11 biology CBSE
State the laws of reflection of light
Explain zero factorial class 11 maths CBSE