


How do you graph $y < x$ and $x > 5$ on the axes?
Answer
568.5k+ views
Hint:
We have to plot two inequalities on the graph. The plotting of an inequation is an area where all the points satisfy the inequation. We have found such an area where all the points satisfy the given two conditions or constraints. For plotting an inequation we first plot the equation that we get by just replacing the inequality sign with ‘=’ sign. And then we choose the area satisfied by the inequation.
Complete step by step solution:
We are given two inequalities $y < x$ and $x > 5$ that we have to plot on the graph. Both inequalities are to be plotted simultaneously on the same graph and all the points in the resulting area should satisfy both the conditions or constraints.
But for the ease of explanation here we will plot the graphs differently and then present the combined result.
First we will plot $y < x$ on the graph. For this we have drawn the line $y = x$ and then choose the suitable area satisfying the condition $y < x$.
For plotting the straight line we need two points which we can get by putting two values of $x$ and getting corresponding values of $y$.
For $x = 1,{\kern 1pt} {\kern 1pt} {\kern 1pt} {\kern 1pt} y = 1$ and for $x = 5,{\kern 1pt} {\kern 1pt} {\kern 1pt} {\kern 1pt} {\kern 1pt} y = 5$. Thus we get two points as $(1,1)$ and $(5,5)$. This we plot and join and then extrapolate to get the graph of line $y = x$. The graph is now divided into two areas. Now on the graph we choose a point on the left side of the line $y = x$, let us say $( - 5,5)$. We see that $( - 5,5)$ does not satisfy $y < x$. So we choose a point from the right side of the line, let us say $(10,5)$. This point satisfies $y < x$. So the right side of the line is the desired area, as indicated by the arrows and shaded in blue in the Fig. 1.
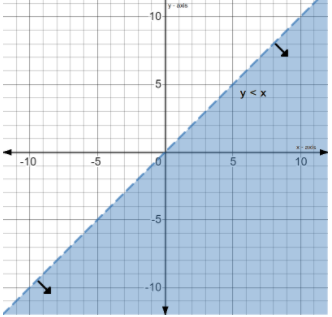
Fig. 1 - Graph of $y < x$
Now we plot $x > 5$ on the same graph. For this we have drawn the line $x = 5$ and then choose the suitable area satisfying the condition $x > 5$.
Here the value of $x$ is $5$ for all values of $y$. So we get a straight vertical line passing through $x = 5$.
The graph is now divided into two areas corresponding to $x = 5$. Now on the graph we choose a point on the left side of this line, let us say $(4,3)$. We see that $(4,3)$ does not satisfy $x > 5$. So we choose a point from the right side of the line, let us say $(10,5)$. This point satisfies $x > 5$. So the right side of the line is the desired area, as indicated by arrows and shaded in green in the Fig. 2.
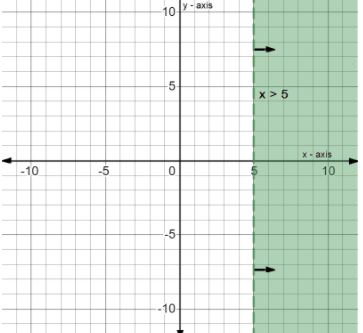
Fig. 2 - Graph of $x > 5$
We have to plot both the above graphs in the same graph to get the desired result. The resulting graph is shown in Fig. 3.
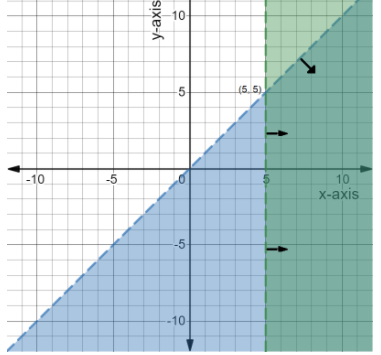
Fig. 3 - Graph of $y < x$ and $x > 5$
The resulting area is the darkened region in Fig. 3, also indicated by the arrows. All the points in this region will satisfy both the conditions $y < x$ and $x > 5$.
Note:
The line of the graphs $y = x$ and $x = 5$ are shown by dashes and not solid lines. This means that the points on this line are not included in the result as $y$ is strictly less than $x$ and $x$ is strictly more than $5$. Any point in the resulting area should satisfy the conditions given in the question.
We have to plot two inequalities on the graph. The plotting of an inequation is an area where all the points satisfy the inequation. We have found such an area where all the points satisfy the given two conditions or constraints. For plotting an inequation we first plot the equation that we get by just replacing the inequality sign with ‘=’ sign. And then we choose the area satisfied by the inequation.
Complete step by step solution:
We are given two inequalities $y < x$ and $x > 5$ that we have to plot on the graph. Both inequalities are to be plotted simultaneously on the same graph and all the points in the resulting area should satisfy both the conditions or constraints.
But for the ease of explanation here we will plot the graphs differently and then present the combined result.
First we will plot $y < x$ on the graph. For this we have drawn the line $y = x$ and then choose the suitable area satisfying the condition $y < x$.
For plotting the straight line we need two points which we can get by putting two values of $x$ and getting corresponding values of $y$.
For $x = 1,{\kern 1pt} {\kern 1pt} {\kern 1pt} {\kern 1pt} y = 1$ and for $x = 5,{\kern 1pt} {\kern 1pt} {\kern 1pt} {\kern 1pt} {\kern 1pt} y = 5$. Thus we get two points as $(1,1)$ and $(5,5)$. This we plot and join and then extrapolate to get the graph of line $y = x$. The graph is now divided into two areas. Now on the graph we choose a point on the left side of the line $y = x$, let us say $( - 5,5)$. We see that $( - 5,5)$ does not satisfy $y < x$. So we choose a point from the right side of the line, let us say $(10,5)$. This point satisfies $y < x$. So the right side of the line is the desired area, as indicated by the arrows and shaded in blue in the Fig. 1.
Fig. 1 - Graph of $y < x$
Now we plot $x > 5$ on the same graph. For this we have drawn the line $x = 5$ and then choose the suitable area satisfying the condition $x > 5$.
Here the value of $x$ is $5$ for all values of $y$. So we get a straight vertical line passing through $x = 5$.
The graph is now divided into two areas corresponding to $x = 5$. Now on the graph we choose a point on the left side of this line, let us say $(4,3)$. We see that $(4,3)$ does not satisfy $x > 5$. So we choose a point from the right side of the line, let us say $(10,5)$. This point satisfies $x > 5$. So the right side of the line is the desired area, as indicated by arrows and shaded in green in the Fig. 2.
Fig. 2 - Graph of $x > 5$
We have to plot both the above graphs in the same graph to get the desired result. The resulting graph is shown in Fig. 3.
Fig. 3 - Graph of $y < x$ and $x > 5$
The resulting area is the darkened region in Fig. 3, also indicated by the arrows. All the points in this region will satisfy both the conditions $y < x$ and $x > 5$.
Note:
The line of the graphs $y = x$ and $x = 5$ are shown by dashes and not solid lines. This means that the points on this line are not included in the result as $y$ is strictly less than $x$ and $x$ is strictly more than $5$. Any point in the resulting area should satisfy the conditions given in the question.
Recently Updated Pages
Master Class 11 English: Engaging Questions & Answers for Success
Master Class 11 Maths: Engaging Questions & Answers for Success
Class 11 Question and Answer - Your Ultimate Solutions Guide
Master Class 11 Biology: Engaging Questions & Answers for Success
Master Class 11 Physics: Engaging Questions & Answers for Success
Master Class 11 Accountancy: Engaging Questions & Answers for Success
Trending doubts
Explain the Treaty of Vienna of 1815 class 10 social science CBSE
Who Won 36 Oscar Awards? Record Holder Revealed
What is the median of the first 10 natural numbers class 10 maths CBSE
Why is it 530 pm in india when it is 1200 afternoon class 10 social science CBSE
Select the word that is correctly spelled a Twelveth class 10 english CBSE
Why is there a time difference of about 5 hours between class 10 social science CBSE