


How do you graph \[y = x + 5\] by plotting points?
Answer
537.6k+ views
Hint: In the given question, we have been given an equation in two variables. We have to plot the line on a graph which forms from this equation. To do that, we first convert the given equation to slope-intercept form. From there, we find out the value of slope and the y-intercept. We plot a point at the y-intercept on y-axis. From there, we move up or down and then right or left depending upon the coefficient of \[x\] and \[y\] respectively and join the points to form the line.
Complete step by step solution:
\[y = x + 5\]
Comparing with the standard form of a linear equation in slope-intercept,
\[y = mx + b\]
Thus, slope \[m = 1\]
And y-intercept \[b = 5\]
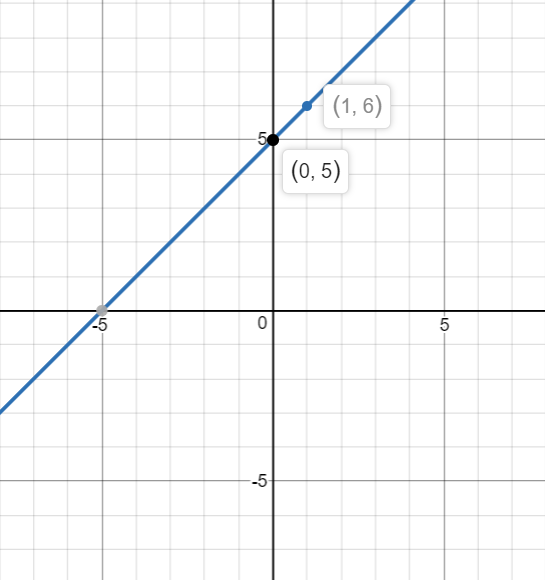
Hence, one point on the graph can be taken as \[\left( {0,5} \right)\].
Now,
\[m = \dfrac{{coefficient\ of\ x}}{{coefficient\ of\ y}} = \dfrac{{run}}{{rise}}\]
Hence, we move up \[1\] (coefficient of \[y\]) points and then move to the right \[1\] (coefficient of \[x\]) points.
Thus, the second point is \[\left( {0 + 1,5 + 1} \right) = \left( {1,6} \right)\].
Now, we plot the two points and join them, and we have our line.
Additional Information: We took one point as the y-intercept because we know that y-intercept means that the point lies on the x-axis.
The meaning of slope is run divided by rise, i.e., \[\dfrac{{coefficient\ of\ x}}{{coefficient\ of\ y}}\].
Slope can also be defined as (Change in y)/(Change in x).
Note: In this question, we only need to know one thing – how to get the points for the graph and then, how to plot the points on the graph. Then we just calculate the values from the equation, plot them on the graph, join the points on the graph and we get the line which marks the required equation.
Complete step by step solution:
\[y = x + 5\]
Comparing with the standard form of a linear equation in slope-intercept,
\[y = mx + b\]
Thus, slope \[m = 1\]
And y-intercept \[b = 5\]
Hence, one point on the graph can be taken as \[\left( {0,5} \right)\].
Now,
\[m = \dfrac{{coefficient\ of\ x}}{{coefficient\ of\ y}} = \dfrac{{run}}{{rise}}\]
Hence, we move up \[1\] (coefficient of \[y\]) points and then move to the right \[1\] (coefficient of \[x\]) points.
Thus, the second point is \[\left( {0 + 1,5 + 1} \right) = \left( {1,6} \right)\].
Now, we plot the two points and join them, and we have our line.
Additional Information: We took one point as the y-intercept because we know that y-intercept means that the point lies on the x-axis.
The meaning of slope is run divided by rise, i.e., \[\dfrac{{coefficient\ of\ x}}{{coefficient\ of\ y}}\].
Slope can also be defined as (Change in y)/(Change in x).
Note: In this question, we only need to know one thing – how to get the points for the graph and then, how to plot the points on the graph. Then we just calculate the values from the equation, plot them on the graph, join the points on the graph and we get the line which marks the required equation.
Recently Updated Pages
Master Class 11 Computer Science: Engaging Questions & Answers for Success
Master Class 11 Business Studies: Engaging Questions & Answers for Success
Master Class 11 Economics: Engaging Questions & Answers for Success
Master Class 11 English: Engaging Questions & Answers for Success
Master Class 11 Maths: Engaging Questions & Answers for Success
Master Class 11 Biology: Engaging Questions & Answers for Success
Trending doubts
One Metric ton is equal to kg A 10000 B 1000 C 100 class 11 physics CBSE
There are 720 permutations of the digits 1 2 3 4 5 class 11 maths CBSE
Discuss the various forms of bacteria class 11 biology CBSE
Draw a diagram of a plant cell and label at least eight class 11 biology CBSE
State the laws of reflection of light
Explain zero factorial class 11 maths CBSE