


How do you graph $y = \sin \left( {x + 30^\circ } \right)$?
Answer
545.4k+ views
Hint:
To solve this question, we will use the graph for the basic sine function which is $\sin x$. It is important to know that when we add or subtract from an angle, the graph will shift left or right. In this problem, $30^\circ $is added to $x$ and therefore the graph will shift to the left.
Complete step by step solution:
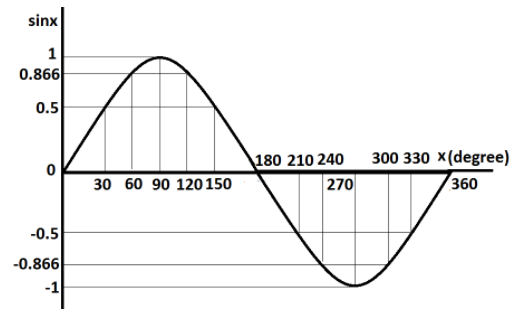
First we will see the graph of $\sin x$.
Let us plot the graph of $\sin x$ for the values of $x$starting from $0^\circ $to $360^\circ $ at the interval of $30^\circ $.
This table shows the values of the function $\sin x$ for different values of $x$.
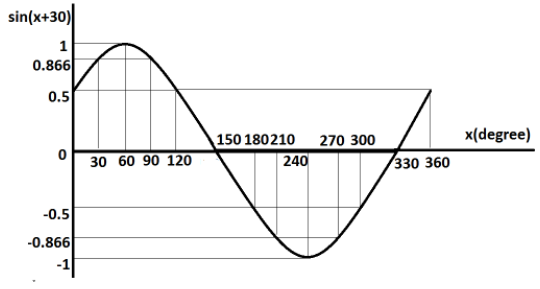
Now, we will plot the graph of $y = \sin \left( {x + 30^\circ } \right)$ for the values of $x$ starting from $0^\circ $ to $360^\circ $ at the interval of $30^\circ $.
The following table shows the values of the function $y = \sin \left( {x + 30^\circ } \right)$ for different values of $x$.
Thus, by this method, we can graph the function $y = \sin \left( {x + 30^\circ } \right)$.
Note:
In this question, if we compare both the graphs, it is clearly seen that both are of the same shape. The only difference is that the second graph which is of the function $y = \sin \left( {x + 30^\circ } \right)$ has shifted to the left by 30 degree then the graph of the function $\sin x$. This is because here, 30 degrees is added to the angle. If this 30 degree is subtracted from the angle, the similar graph would be obtained but it would be shifted to right.
To solve this question, we will use the graph for the basic sine function which is $\sin x$. It is important to know that when we add or subtract from an angle, the graph will shift left or right. In this problem, $30^\circ $is added to $x$ and therefore the graph will shift to the left.
Complete step by step solution:
First we will see the graph of $\sin x$.
Let us plot the graph of $\sin x$ for the values of $x$starting from $0^\circ $to $360^\circ $ at the interval of $30^\circ $.
This table shows the values of the function $\sin x$ for different values of $x$.
| $x$(degree) | $\sin x$ |
| 0 | 0 |
| 30 | $\dfrac{{\sqrt 3 }}{2} = 0.866$ |
| 60 | $\dfrac{{\sqrt 3 }}{2} = 0.866$ |
| 90 | 1 |
| 120 | $\dfrac{{\sqrt 3 }}{2} = 0.866$ |
| 150 | $\dfrac{{\sqrt 3 }}{2} = 0.866$ |
| 180 | 0 |
| 210 | $ - \dfrac{1}{2} = - 0.5$ |
| 240 | $ - \dfrac{{\sqrt 3 }}{2} = - 0.866$ |
| 270 | $ - 1$ |
| 300 | $ - \dfrac{{\sqrt 3 }}{2} = - 0.866$ |
| 330 | $ - \dfrac{1}{2} = - 0.5$ |
| 360 | 0 |
Now, we will plot the graph of $y = \sin \left( {x + 30^\circ } \right)$ for the values of $x$ starting from $0^\circ $ to $360^\circ $ at the interval of $30^\circ $.
The following table shows the values of the function $y = \sin \left( {x + 30^\circ } \right)$ for different values of $x$.
| $x$(degree) | $\left( {x + 30} \right)$(degree) | $y = \sin \left( {x + 30} \right)$ |
| 0 | 30 | $\dfrac{{\sqrt 3 }}{2} = 0.866$ |
| 30 | 60 | $\dfrac{{\sqrt 3 }}{2} = 0.866$ |
| 60 | 90 | 1 |
| 90 | 120 | $\dfrac{{\sqrt 3 }}{2} = 0.866$ |
| 120 | 150 | $\dfrac{{\sqrt 3 }}{2} = 0.866$ |
| 150 | 180 | 0 |
| 180 | 210 | $ - \dfrac{1}{2} = - 0.5$ |
| 210 | 240 | $ - \dfrac{{\sqrt 3 }}{2} = - 0.866$ |
| 240 | 270 | $ - 1$ |
| 270 | 300 | $ - \dfrac{{\sqrt 3 }}{2} = - 0.866$ |
| 300 | 330 | $ - \dfrac{1}{2} = - 0.5$ |
| 330 | 360 | 0 |
| 360 | 390 | $\dfrac{{\sqrt 3 }}{2} = 0.866$ |
Thus, by this method, we can graph the function $y = \sin \left( {x + 30^\circ } \right)$.
Note:
In this question, if we compare both the graphs, it is clearly seen that both are of the same shape. The only difference is that the second graph which is of the function $y = \sin \left( {x + 30^\circ } \right)$ has shifted to the left by 30 degree then the graph of the function $\sin x$. This is because here, 30 degrees is added to the angle. If this 30 degree is subtracted from the angle, the similar graph would be obtained but it would be shifted to right.
Recently Updated Pages
Master Class 11 Computer Science: Engaging Questions & Answers for Success
Master Class 11 Business Studies: Engaging Questions & Answers for Success
Master Class 11 Economics: Engaging Questions & Answers for Success
Master Class 11 English: Engaging Questions & Answers for Success
Master Class 11 Maths: Engaging Questions & Answers for Success
Master Class 11 Biology: Engaging Questions & Answers for Success
Trending doubts
One Metric ton is equal to kg A 10000 B 1000 C 100 class 11 physics CBSE
There are 720 permutations of the digits 1 2 3 4 5 class 11 maths CBSE
Discuss the various forms of bacteria class 11 biology CBSE
Draw a diagram of a plant cell and label at least eight class 11 biology CBSE
State the laws of reflection of light
Explain zero factorial class 11 maths CBSE