


How do you graph $y = \log \left( {x + 1} \right) - 7$?
Answer
562.5k+ views
Hint: To solve this question, we need to follow some certain steps. First, we need to find asymptotes for the given functions. After that we will find the y-intercept of the graph which is the point at which the value of $x$ will be zero. Finally we will find another two points by using two different values of $x$ which will help us to plot the graph.
Complete step by step solution:
We are given the function $y = \log \left( {x + 1} \right) - 7$.
First, we will find the asymptotes of the function. This means that we need to find where the given function cannot be defined.
We know that the logarithm of the number exists only if the number is greater than zero.
Therefore, for the given function $y = \log \left( {x + 1} \right) - 7$, we can say that the function cannot be defined for the values of $x$ less than or equal to $ - 1$ which is $x \leqslant - 1$.
Therefore, for vertical asymptotes for the given function is $x = - 1$.
Now, we will find the y-intercept of the graph. This can be done by putting the value of $x$ as zero.
$y = \log \left( {x + 1} \right) - 7$
We will now put $x = 0$.
$ \Rightarrow y = \log \left( {0 + 1} \right) - 7 = \log 1 - 7 = 0 - 7 = - 7$
Therefore, the y-intercept of the function is $\left( {0, - 7} \right)$.
Now, let us find the point where $x = 1$.
$y = \log \left( {x + 1} \right) - 7$
We will now put $x = 1$.
$ \Rightarrow y = \log \left( {1 + 1} \right) - 7 = \log 2 - 7 = 0.30103 - 7 = - 6.69897$
Therefore, we get a point $\left( {1, - 6.69897} \right)$on the graph.
Now, let us find the point where $x = 9$.
$ \Rightarrow y = \log \left( {9 + 1} \right) - 7 = \log 10 - 7 = 1 - 7 = - 6$
Thus, we get another point $\left( {9, - 6} \right)$ on the graph.
Now we have three points $\left( {0, - 7} \right)$, $\left( {1, - 6.69897} \right)$ and $\left( {9, - 6} \right)$ and the vertical asymptotes $x = - 1$. By using this information, we can get the graph of the function $y = \log \left( {x + 1} \right) - 7$ as:
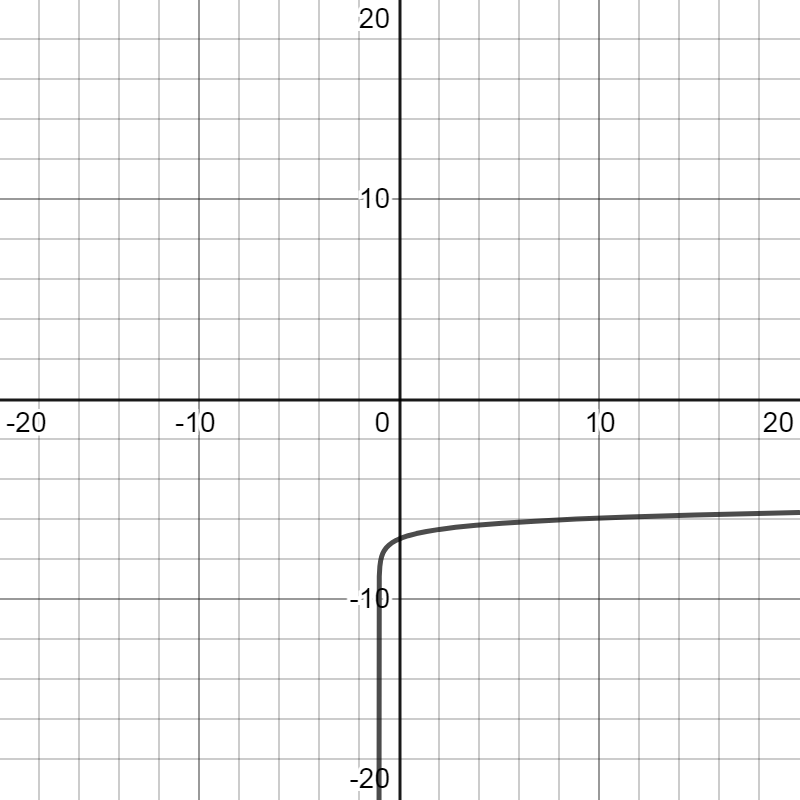
Note: Here, the important thing to note is that the shape of this graph of the function $y = \log \left( {x + 1} \right) - 7$ is the same as the function $y = \log x$. The term $x + 1$ in our function causes the graph to shift one unit to left. And the term $ - 7$ will shift the graph seven units down.
Complete step by step solution:
We are given the function $y = \log \left( {x + 1} \right) - 7$.
First, we will find the asymptotes of the function. This means that we need to find where the given function cannot be defined.
We know that the logarithm of the number exists only if the number is greater than zero.
Therefore, for the given function $y = \log \left( {x + 1} \right) - 7$, we can say that the function cannot be defined for the values of $x$ less than or equal to $ - 1$ which is $x \leqslant - 1$.
Therefore, for vertical asymptotes for the given function is $x = - 1$.
Now, we will find the y-intercept of the graph. This can be done by putting the value of $x$ as zero.
$y = \log \left( {x + 1} \right) - 7$
We will now put $x = 0$.
$ \Rightarrow y = \log \left( {0 + 1} \right) - 7 = \log 1 - 7 = 0 - 7 = - 7$
Therefore, the y-intercept of the function is $\left( {0, - 7} \right)$.
Now, let us find the point where $x = 1$.
$y = \log \left( {x + 1} \right) - 7$
We will now put $x = 1$.
$ \Rightarrow y = \log \left( {1 + 1} \right) - 7 = \log 2 - 7 = 0.30103 - 7 = - 6.69897$
Therefore, we get a point $\left( {1, - 6.69897} \right)$on the graph.
Now, let us find the point where $x = 9$.
$ \Rightarrow y = \log \left( {9 + 1} \right) - 7 = \log 10 - 7 = 1 - 7 = - 6$
Thus, we get another point $\left( {9, - 6} \right)$ on the graph.
Now we have three points $\left( {0, - 7} \right)$, $\left( {1, - 6.69897} \right)$ and $\left( {9, - 6} \right)$ and the vertical asymptotes $x = - 1$. By using this information, we can get the graph of the function $y = \log \left( {x + 1} \right) - 7$ as:
Note: Here, the important thing to note is that the shape of this graph of the function $y = \log \left( {x + 1} \right) - 7$ is the same as the function $y = \log x$. The term $x + 1$ in our function causes the graph to shift one unit to left. And the term $ - 7$ will shift the graph seven units down.
Recently Updated Pages
Master Class 10 Social Science: Engaging Questions & Answers for Success
Master Class 10 Science: Engaging Questions & Answers for Success
Master Class 10 Maths: Engaging Questions & Answers for Success
Master Class 10 General Knowledge: Engaging Questions & Answers for Success
Master Class 10 Computer Science: Engaging Questions & Answers for Success
Class 10 Question and Answer - Your Ultimate Solutions Guide
Trending doubts
What is the full form of PNG A Petrol Natural Gas B class 10 chemistry CBSE
Explain the Treaty of Vienna of 1815 class 10 social science CBSE
In cricket, how many legal balls are there in a standard over?
Why is there a time difference of about 5 hours between class 10 social science CBSE
Who Won 36 Oscar Awards? Record Holder Revealed
What is the median of the first 10 natural numbers class 10 maths CBSE