


How would you graph $ y = \ln \left( {x - 1} \right) + 3 $ ?
Answer
528.3k+ views
Hint: A graph of a function f is the set of ordered pairs; the equation of graph is generally represented as $ y = f\left( x \right) $ , where x and $ f\left( x \right) $ are real numbers. We substitute the value of x and we determine the value of y and then we mark the points in the graph and we join the points.
Complete step by step solution:
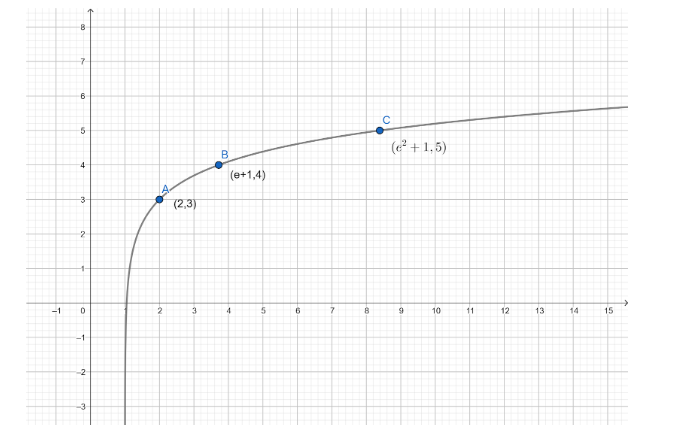
Here, in the given question, we have to plot the graph for the given function. A graph of a function is a set of ordered pairs and it is represented as $ y = f\left( x \right) $ , where x and $ f\left( x \right) $ are real numbers. These pairs are in the form of cartesian coordinates and the graph is the two-dimensional graph.
First, we have to find the value of y by using the graph equation $ y = \ln \left( {x - 1} \right) + 3 $ .
Let us substitute the value of x as $ 2 $ .
$ \Rightarrow y = \ln \left( {2 - 1} \right) + 3 $
$ \Rightarrow y = \ln \left( 1 \right) + 3 $
We know that the value of $ \ln \left( 1 \right) $ is zero. So, we get,
$ \Rightarrow y = 0 + 3 $
$ \Rightarrow y = 3 $
Now we consider the value of x as $ e + 1 $ , the value of y is
$ \Rightarrow y = \ln \left( {\left( {e + 1} \right) - 1} \right) + 3 $
Simplifying the expression,
$ \Rightarrow y = \ln \left( e \right) + 3 $
Now, we know that the value of $ \ln \left( e \right) $ is one. So, we get,
$ \Rightarrow y = 1 + 3 $
$ \Rightarrow y = 4 $
Now we consider the value of x as $ {e^2} + 1 $ , the value of y is
$ \Rightarrow y = \ln \left( {\left( {{e^2} + 1} \right) - 1} \right) + 3 $
Simplifying the expression,
$ \Rightarrow y = \ln \left( {{e^2}} \right) + 3 $
Now, we know that the value of $ \ln \left( e \right) $ is one. So, we get,
$ \Rightarrow y = 2 + 3 $
$ \Rightarrow y = 5 $
Now we draw a table for these values we have
We also know the nature of the graph of logarithmic function. Hence, we can now plot the graph of the given function $ y = \ln \left( {x - 1} \right) + 3 $ with the help of coordinates of the points. The nature of the graph of a function and its slope can also be determined from the derivative of the function. The graph plotted for these points is represented below:
Note: The number ‘e’ in mathematics is known as the euler’s number. It is a mathematical constant and has a value approximately equal to $ 2.71828 $ . It is the base of the natural logarithm that is used in many steps in the given problem.
Complete step by step solution:
Here, in the given question, we have to plot the graph for the given function. A graph of a function is a set of ordered pairs and it is represented as $ y = f\left( x \right) $ , where x and $ f\left( x \right) $ are real numbers. These pairs are in the form of cartesian coordinates and the graph is the two-dimensional graph.
First, we have to find the value of y by using the graph equation $ y = \ln \left( {x - 1} \right) + 3 $ .
Let us substitute the value of x as $ 2 $ .
$ \Rightarrow y = \ln \left( {2 - 1} \right) + 3 $
$ \Rightarrow y = \ln \left( 1 \right) + 3 $
We know that the value of $ \ln \left( 1 \right) $ is zero. So, we get,
$ \Rightarrow y = 0 + 3 $
$ \Rightarrow y = 3 $
Now we consider the value of x as $ e + 1 $ , the value of y is
$ \Rightarrow y = \ln \left( {\left( {e + 1} \right) - 1} \right) + 3 $
Simplifying the expression,
$ \Rightarrow y = \ln \left( e \right) + 3 $
Now, we know that the value of $ \ln \left( e \right) $ is one. So, we get,
$ \Rightarrow y = 1 + 3 $
$ \Rightarrow y = 4 $
Now we consider the value of x as $ {e^2} + 1 $ , the value of y is
$ \Rightarrow y = \ln \left( {\left( {{e^2} + 1} \right) - 1} \right) + 3 $
Simplifying the expression,
$ \Rightarrow y = \ln \left( {{e^2}} \right) + 3 $
Now, we know that the value of $ \ln \left( e \right) $ is one. So, we get,
$ \Rightarrow y = 2 + 3 $
$ \Rightarrow y = 5 $
Now we draw a table for these values we have
| x | $ 2 $ | $ \left( {e + 1} \right) $ | $ \left( {{e^2} + 1} \right) $ |
| y | $ 3 $ | $ 4 $ | $ 5 $ |
We also know the nature of the graph of logarithmic function. Hence, we can now plot the graph of the given function $ y = \ln \left( {x - 1} \right) + 3 $ with the help of coordinates of the points. The nature of the graph of a function and its slope can also be determined from the derivative of the function. The graph plotted for these points is represented below:
Note: The number ‘e’ in mathematics is known as the euler’s number. It is a mathematical constant and has a value approximately equal to $ 2.71828 $ . It is the base of the natural logarithm that is used in many steps in the given problem.
Recently Updated Pages
Master Class 11 English: Engaging Questions & Answers for Success
Master Class 11 Maths: Engaging Questions & Answers for Success
Master Class 11 Biology: Engaging Questions & Answers for Success
Master Class 11 Social Science: Engaging Questions & Answers for Success
Master Class 11 Physics: Engaging Questions & Answers for Success
Master Class 11 Accountancy: Engaging Questions & Answers for Success
Trending doubts
One Metric ton is equal to kg A 10000 B 1000 C 100 class 11 physics CBSE
There are 720 permutations of the digits 1 2 3 4 5 class 11 maths CBSE
Discuss the various forms of bacteria class 11 biology CBSE
Draw a diagram of a plant cell and label at least eight class 11 biology CBSE
State the laws of reflection of light
Explain zero factorial class 11 maths CBSE