


How do you graph \[y = \dfrac{{2x(x - 2)}}{{(x - 3)(x + 1)}}\] ?
Answer
546k+ views
Hint: In this question we are given y in terms of x, that is, y is the dependent variable as its value changes with the value of x and x is the independent variable. “y” is equal to a fraction containing “x” in both the numerator and the denominator, the degree of “x” is 2 in both the numerator and the denominator. So, the graph of this function will not be a straight line but two curves. Thus, on putting random values of x, we can find the values of y and graph this equation.
Complete step by step solution:
We have to graph \[y = \dfrac{{2x(x - 2)}}{{(x - 3)(x + 1)}}\]
We know that for “y” to be defined, the denominator should not be equal to zero –
$
x - 3 = 0,\,x + 1 = 0 \\
\Rightarrow x = 3,\,x = - 1 \;
$
So, y is not defined at $x = 3$ and $x = - 1$ .
Thus the vertical asymptote of the given function is at $x = 3$ and $x = - 1$ .
Now,
At $x = \pm \infty $
$
y = \dfrac{{2( \pm \infty )( \pm \infty - 2)}}{{( \pm \infty - 3)( \pm \infty + 1)}} = \dfrac{{2( \pm \infty )( \pm \infty )}}{{( \pm \infty )( \pm \infty )}} \\
\Rightarrow y = 2 \;
$
Thus the horizontal asymptote of the given function is at $y = 2$ .
We can find the coordinates of a few points lying on the curve by putting random values of x –
At $x = 1,\,y = \dfrac{{2(1)(1 - 2)}}{{(1 - 3)(1 + 1)}} = \dfrac{{ - 2}}{{ - 4}} = 0.5$
At $x = 4,\,y = \dfrac{{2(4)(4 - 2)}}{{(4 - 3)(4 + 1)}} = \dfrac{{16}}{5} = 3.2$
At $x = - 2,\,y = \dfrac{{2( - 2)( - 2 - 2)}}{{( - 2 - 3)( - 2 + 1)}} = \dfrac{{16}}{5} = 3.2$
At $x = - 3,\,y = \dfrac{{2( - 3)( - 3 - 2)}}{{( - 3 - 3)( - 3 + 1)}} = \dfrac{{30}}{{12}} = 2.5$
Joining these points, we can plot the graph of \[y = \dfrac{{2x(x - 2)}}{{(x - 3)(x + 1)}}\] as –
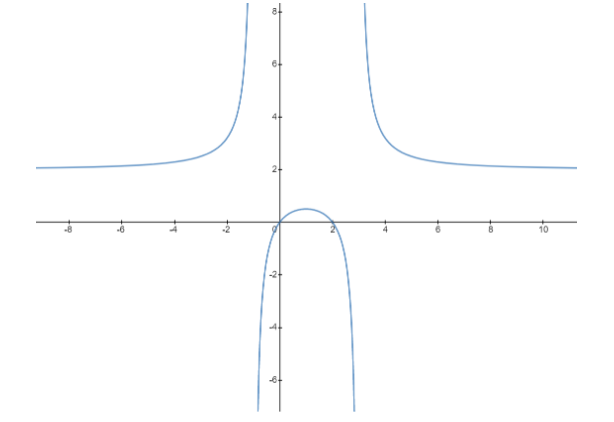
Note: The horizontal lines that the graph of function approaches when x tends to $ + \infty $ or $ - \infty $ are called horizontal asymptotes. In the graph of the given equation, we see that the curve approaches the horizontal line $y = 2$ as the value of x tends to $ + \infty $ or $ - \infty $ . Similarly the vertical lines that the graph of the function approaches when y tends to $ + \infty $ or $ - \infty $ are called the vertical asymptotes. In the graph of the given function, we see that the curve approaches the vertical line $x = - 1$ and $x = 3$ when y tends to $ + \infty $ or $ - \infty $
Complete step by step solution:
We have to graph \[y = \dfrac{{2x(x - 2)}}{{(x - 3)(x + 1)}}\]
We know that for “y” to be defined, the denominator should not be equal to zero –
$
x - 3 = 0,\,x + 1 = 0 \\
\Rightarrow x = 3,\,x = - 1 \;
$
So, y is not defined at $x = 3$ and $x = - 1$ .
Thus the vertical asymptote of the given function is at $x = 3$ and $x = - 1$ .
Now,
At $x = \pm \infty $
$
y = \dfrac{{2( \pm \infty )( \pm \infty - 2)}}{{( \pm \infty - 3)( \pm \infty + 1)}} = \dfrac{{2( \pm \infty )( \pm \infty )}}{{( \pm \infty )( \pm \infty )}} \\
\Rightarrow y = 2 \;
$
Thus the horizontal asymptote of the given function is at $y = 2$ .
We can find the coordinates of a few points lying on the curve by putting random values of x –
At $x = 1,\,y = \dfrac{{2(1)(1 - 2)}}{{(1 - 3)(1 + 1)}} = \dfrac{{ - 2}}{{ - 4}} = 0.5$
At $x = 4,\,y = \dfrac{{2(4)(4 - 2)}}{{(4 - 3)(4 + 1)}} = \dfrac{{16}}{5} = 3.2$
At $x = - 2,\,y = \dfrac{{2( - 2)( - 2 - 2)}}{{( - 2 - 3)( - 2 + 1)}} = \dfrac{{16}}{5} = 3.2$
At $x = - 3,\,y = \dfrac{{2( - 3)( - 3 - 2)}}{{( - 3 - 3)( - 3 + 1)}} = \dfrac{{30}}{{12}} = 2.5$
Joining these points, we can plot the graph of \[y = \dfrac{{2x(x - 2)}}{{(x - 3)(x + 1)}}\] as –
Note: The horizontal lines that the graph of function approaches when x tends to $ + \infty $ or $ - \infty $ are called horizontal asymptotes. In the graph of the given equation, we see that the curve approaches the horizontal line $y = 2$ as the value of x tends to $ + \infty $ or $ - \infty $ . Similarly the vertical lines that the graph of the function approaches when y tends to $ + \infty $ or $ - \infty $ are called the vertical asymptotes. In the graph of the given function, we see that the curve approaches the vertical line $x = - 1$ and $x = 3$ when y tends to $ + \infty $ or $ - \infty $
Recently Updated Pages
Master Class 9 General Knowledge: Engaging Questions & Answers for Success
Master Class 9 Social Science: Engaging Questions & Answers for Success
Master Class 9 English: Engaging Questions & Answers for Success
Master Class 9 Maths: Engaging Questions & Answers for Success
Master Class 9 Science: Engaging Questions & Answers for Success
Class 9 Question and Answer - Your Ultimate Solutions Guide
Trending doubts
Difference Between Plant Cell and Animal Cell
Fill the blanks with the suitable prepositions 1 The class 9 english CBSE
Who is eligible for RTE class 9 social science CBSE
Which places in India experience sunrise first and class 9 social science CBSE
What is pollution? How many types of pollution? Define it
Name 10 Living and Non living things class 9 biology CBSE