


How do you graph $ y = - \dfrac{2}{3}x - 2 $ using rise over run?
Answer
560.7k+ views
Hint: Rise over run is a commonly used method for finding the slope of a line. While moving from one point to another, the units we move up or down are called rise and the units we move right or left are known as run. On the graph, rise means the change in y coordinate and run means the change in the x-coordinate. We can find out the correct answer by using the above-mentioned information.
Complete step-by-step answer:
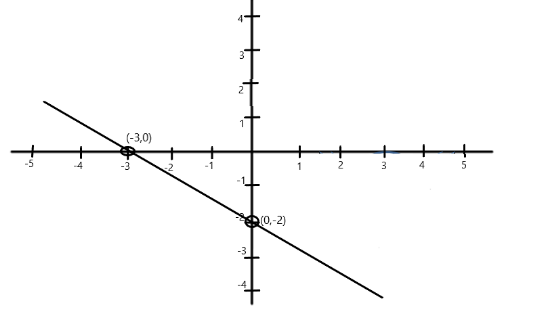
The equation of the line is \[y = - \dfrac{2}{3}x - 2\]
The equation is in slope-intercept form, so the slope of the line is $ \dfrac{{ - 2}}{3} $ and the y-intercept is $ - 2 $ .
So one of the points is $ (0, - 2) $
Now, the slope of the line is equal to
$ m = \dfrac{{change\,in\,y}}{{change\,in\,x}} = \dfrac{{ - 2}}{3} $
As the change in y is 2, so we move up from -2 to 0.
And the change in x is 3, but the slope is negative so we move left from 0 to -3.
Thus, the second point of the line is $ ( - 3,0) $
Hence, this line can be graphed as –
Note: For plotting the graph of a line, we must know the coordinates of at least two points lying on the line. We know the coordinates of one point through which the given line passes and we know the slope, using which we find the coordinates of the second point. Thus, we can find the graph of the given line by first plotting the two points on the graph and then joining them.
Complete step-by-step answer:
The equation of the line is \[y = - \dfrac{2}{3}x - 2\]
The equation is in slope-intercept form, so the slope of the line is $ \dfrac{{ - 2}}{3} $ and the y-intercept is $ - 2 $ .
So one of the points is $ (0, - 2) $
Now, the slope of the line is equal to
$ m = \dfrac{{change\,in\,y}}{{change\,in\,x}} = \dfrac{{ - 2}}{3} $
As the change in y is 2, so we move up from -2 to 0.
And the change in x is 3, but the slope is negative so we move left from 0 to -3.
Thus, the second point of the line is $ ( - 3,0) $
Hence, this line can be graphed as –
Note: For plotting the graph of a line, we must know the coordinates of at least two points lying on the line. We know the coordinates of one point through which the given line passes and we know the slope, using which we find the coordinates of the second point. Thus, we can find the graph of the given line by first plotting the two points on the graph and then joining them.
Recently Updated Pages
Master Class 11 Computer Science: Engaging Questions & Answers for Success
Master Class 11 Business Studies: Engaging Questions & Answers for Success
Master Class 11 Economics: Engaging Questions & Answers for Success
Master Class 11 English: Engaging Questions & Answers for Success
Master Class 11 Maths: Engaging Questions & Answers for Success
Master Class 11 Biology: Engaging Questions & Answers for Success
Trending doubts
One Metric ton is equal to kg A 10000 B 1000 C 100 class 11 physics CBSE
There are 720 permutations of the digits 1 2 3 4 5 class 11 maths CBSE
Discuss the various forms of bacteria class 11 biology CBSE
Draw a diagram of a plant cell and label at least eight class 11 biology CBSE
State the laws of reflection of light
Explain zero factorial class 11 maths CBSE