


How do you graph \[y = \dfrac{1}{5}x - 3\] by plotting points?
Answer
545.1k+ views
Hint:
To graph an equation by plotting points, the easiest way to find points on the line of the given equation \[y = \dfrac{1}{5}x - 3\] is to convert the given equation in point slope form to slope intercept form: \[y = mx + b\], where m is the slope, and b is the y-intercept. In order to do this, solve the point slope equation for y, then consider any x values to graph the solution.
Complete step by step solution:
Let us write the given linear equation:
\[y = \dfrac{1}{5}x - 3\]
To graph the equation by plotting points, we need to create a table of values that satisfies the given equation:
\[f\left( x \right) = x\],
\[f\left( x \right) = \left( {\dfrac{1}{5}} \right) \cdot x\],
\[f\left( x \right) = \left[ {\left( {\dfrac{1}{5}} \right) \cdot x} \right] - 3\]
for easy comprehension.
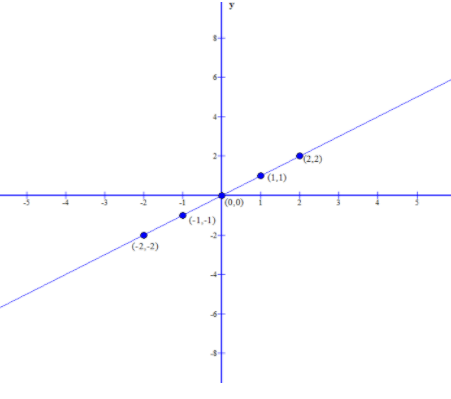
Examine the graph for \[y = f\left( x \right) = x\].
The graph obtained is Slope-Intercept form: \[y = mx + b\],
where m is the slope, and b is the y-intercept.
This is of the form \[y = 1 \cdot x + 0\], where Slope(m)=1 and y-intercept=0
Remember that the Slope(m) is the constant ratio that compares the change in y values over the change in x values between any two points. y-intercept is the coordinate point where the graph crosses the y-axis.
Now let us Examine the graph for \[f\left( x \right) = \left( {\dfrac{1}{5}} \right) \cdot x\]
The graph obtained is Slope-Intercept form: \[y = mx + b\],
In which,
Slope(m) = \[\dfrac{1}{5}\], and y-intercept is 0.
We need to create data table for x and corresponding y values:
\[y = f\left( x \right) = \dfrac{1}{5}x - 3\]
Now construct the graph using these data values.
Examine the graph of \[y = f\left( x \right) = \dfrac{1}{5}x - 3\] as:
The equation is Slope-Intercept form: \[y = mx + b\], and the slope obtained is:
Slope(m) = \[\dfrac{1}{5}\], and y-intercept is \[\left( {0, - 3} \right)\].
Note:
In slope intercept form; very often, linear-equation word problems deal with changes over the course of time i.e., \[y = mx + b\] the number b is the coordinate on the y-axis where the graph crosses the y-axis and also, we can solve the given equation using intercept form i.e., when x = 0, the corresponding y-value is the y-intercept. In the particular context of word problems, the y-intercept (that is, the point when x = 0) also refers to the starting value.
To graph an equation by plotting points, the easiest way to find points on the line of the given equation \[y = \dfrac{1}{5}x - 3\] is to convert the given equation in point slope form to slope intercept form: \[y = mx + b\], where m is the slope, and b is the y-intercept. In order to do this, solve the point slope equation for y, then consider any x values to graph the solution.
Complete step by step solution:
Let us write the given linear equation:
\[y = \dfrac{1}{5}x - 3\]
To graph the equation by plotting points, we need to create a table of values that satisfies the given equation:
\[f\left( x \right) = x\],
\[f\left( x \right) = \left( {\dfrac{1}{5}} \right) \cdot x\],
\[f\left( x \right) = \left[ {\left( {\dfrac{1}{5}} \right) \cdot x} \right] - 3\]
for easy comprehension.
Examine the graph for \[y = f\left( x \right) = x\].
| x | \[f\left( x \right) = x\] |
| -2 | -2 |
| -1 | -1 |
| 0 | 0 |
| 1 | 1 |
| 2 | 2 |
The graph obtained is Slope-Intercept form: \[y = mx + b\],
where m is the slope, and b is the y-intercept.
This is of the form \[y = 1 \cdot x + 0\], where Slope(m)=1 and y-intercept=0
Remember that the Slope(m) is the constant ratio that compares the change in y values over the change in x values between any two points. y-intercept is the coordinate point where the graph crosses the y-axis.
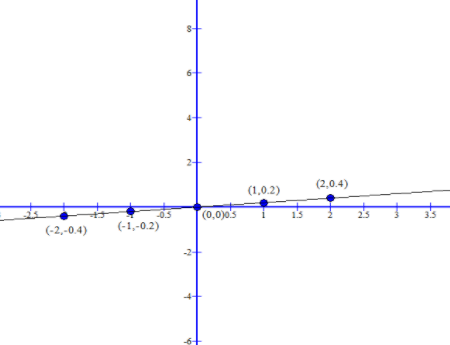
Now let us Examine the graph for \[f\left( x \right) = \left( {\dfrac{1}{5}} \right) \cdot x\]
| x | \[\dfrac{1}{5}x\] |
| -2 | -0.4 |
| -1 | -0.2 |
| 0 | 0 |
| 1 | 0.2 |
| 2 | 0.4 |
The graph obtained is Slope-Intercept form: \[y = mx + b\],
In which,
Slope(m) = \[\dfrac{1}{5}\], and y-intercept is 0.
We need to create data table for x and corresponding y values:
\[y = f\left( x \right) = \dfrac{1}{5}x - 3\]
| x | y |
| -5 | -4.00 |
| -4 | -3.80 |
| -3 | -3.60 |
| -2 | -3.40 |
| -1 | -3.20 |
| 0 | -3.00 |
| 1 | -2.80 |
| 2 | -2.60 |
| 3 | -2.40 |
| 4 | -2.20 |
| 5 | -2.00 |
Now construct the graph using these data values.
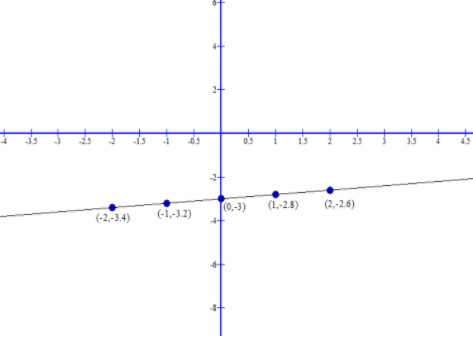
Examine the graph of \[y = f\left( x \right) = \dfrac{1}{5}x - 3\] as:
| x | \[\dfrac{1}{5}x - 3\] |
| -2 | -3.4 |
| -1 | -3.2 |
| 0 | -3 |
| 1 | -2.8 |
| 2 | -2.6 |
The equation is Slope-Intercept form: \[y = mx + b\], and the slope obtained is:
Slope(m) = \[\dfrac{1}{5}\], and y-intercept is \[\left( {0, - 3} \right)\].
Note:
In slope intercept form; very often, linear-equation word problems deal with changes over the course of time i.e., \[y = mx + b\] the number b is the coordinate on the y-axis where the graph crosses the y-axis and also, we can solve the given equation using intercept form i.e., when x = 0, the corresponding y-value is the y-intercept. In the particular context of word problems, the y-intercept (that is, the point when x = 0) also refers to the starting value.
Recently Updated Pages
Master Class 11 English: Engaging Questions & Answers for Success
Master Class 11 Maths: Engaging Questions & Answers for Success
Master Class 11 Biology: Engaging Questions & Answers for Success
Master Class 11 Social Science: Engaging Questions & Answers for Success
Master Class 11 Physics: Engaging Questions & Answers for Success
Master Class 11 Accountancy: Engaging Questions & Answers for Success
Trending doubts
One Metric ton is equal to kg A 10000 B 1000 C 100 class 11 physics CBSE
Discuss the various forms of bacteria class 11 biology CBSE
Draw a diagram of a plant cell and label at least eight class 11 biology CBSE
State the laws of reflection of light
Explain zero factorial class 11 maths CBSE
10 examples of friction in our daily life