


How do you graph y = $ \dfrac{1}{4}x-3 $ by plotting points?
Answer
558k+ views
Hint: Here in this question, we have to solve the equation given which is a linear equation in two variables. We will use the general form of the equation of slope and intercept to solve this problem. The general form of this equation is:
y = mx + c
where m is the slope and c is the constant.
After that, we will put the values for ‘x’ in order to find the value for ‘y’ for a corresponding value of ‘x’. Then plot all the values in a graph to obtain the line.
Complete step by step answer:
Now, let’s solve the question.
We already know that the slope-intercept form is a general form of a straight line and is expressed as y = mx + c where ‘m’ is a slope and c is a constant and intercepts are m and c.
So, for plotting a straight line, first, we have to convert the given equation into a slope-intercept form. Let’s study how!
First, write the equation from the question.
$ \Rightarrow $ y = $ \dfrac{1}{4}x-3......(i) $
As we can observe that the above equation is already in general form of straight line i.e. y = mx + c, here m = $ \dfrac{1}{4} $ and c = -3.
Now, we have to find the intercepts for x and y.
Let’s find y-intercept first. Substitute x = 0 in equation(i) we get:
$ \Rightarrow $ y = $ \dfrac{1}{4}(0)-3 $
Now we get the value of ‘y’ as:
$ \Rightarrow $ y = -3
$ \therefore $ y-intercept form is: $ \left( 0,-3 \right) $
Similarly, we will find x-intercept now. Put y = 0 in equation(i) we get:
$ \Rightarrow $ (0) = $ \dfrac{1}{4}x-3 $
Now, take 3 on the left side, the sign will get change:
$ \Rightarrow $ 3 = $ \dfrac{1}{4}x $
As $ \dfrac{1}{4} $ is in product with ‘x’, now it will be reciprocated and taken to the left side:
$ \Rightarrow 3\times \dfrac{4}{1}=x $
Now the value of x will be:
$ \Rightarrow $ x = 12
$ \therefore $ x-intercept will be: (12, 0)
Let’s plot the graph of the equation with the help of the intercepts.
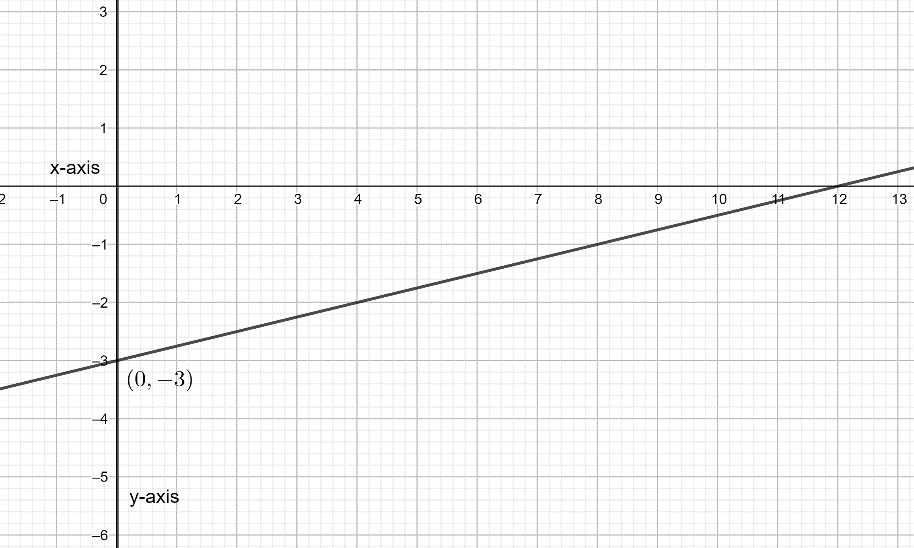
The graph above is of y-intercept: (0, -3).
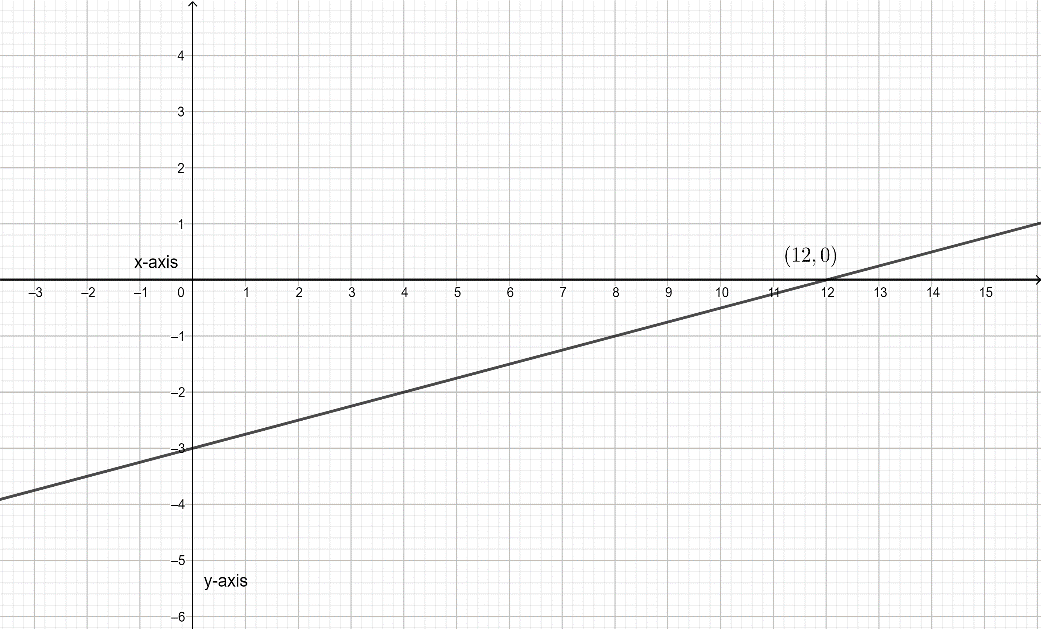
The graph above is of x-intercept: (12, 0).
Note:
We plotted the points by slope and intercept form so that it becomes easy to solve for a particular variable. It is the easiest approach to finding the coordinates. All you need to know the general form of the equation of a straight line. If you are not obtaining a straight line after plotting the points, it means you are going wrong somewhere in the calculation.
y = mx + c
where m is the slope and c is the constant.
After that, we will put the values for ‘x’ in order to find the value for ‘y’ for a corresponding value of ‘x’. Then plot all the values in a graph to obtain the line.
Complete step by step answer:
Now, let’s solve the question.
We already know that the slope-intercept form is a general form of a straight line and is expressed as y = mx + c where ‘m’ is a slope and c is a constant and intercepts are m and c.
So, for plotting a straight line, first, we have to convert the given equation into a slope-intercept form. Let’s study how!
First, write the equation from the question.
$ \Rightarrow $ y = $ \dfrac{1}{4}x-3......(i) $
As we can observe that the above equation is already in general form of straight line i.e. y = mx + c, here m = $ \dfrac{1}{4} $ and c = -3.
Now, we have to find the intercepts for x and y.
Let’s find y-intercept first. Substitute x = 0 in equation(i) we get:
$ \Rightarrow $ y = $ \dfrac{1}{4}(0)-3 $
Now we get the value of ‘y’ as:
$ \Rightarrow $ y = -3
$ \therefore $ y-intercept form is: $ \left( 0,-3 \right) $
Similarly, we will find x-intercept now. Put y = 0 in equation(i) we get:
$ \Rightarrow $ (0) = $ \dfrac{1}{4}x-3 $
Now, take 3 on the left side, the sign will get change:
$ \Rightarrow $ 3 = $ \dfrac{1}{4}x $
As $ \dfrac{1}{4} $ is in product with ‘x’, now it will be reciprocated and taken to the left side:
$ \Rightarrow 3\times \dfrac{4}{1}=x $
Now the value of x will be:
$ \Rightarrow $ x = 12
$ \therefore $ x-intercept will be: (12, 0)
Let’s plot the graph of the equation with the help of the intercepts.
The graph above is of y-intercept: (0, -3).
The graph above is of x-intercept: (12, 0).
Note:
We plotted the points by slope and intercept form so that it becomes easy to solve for a particular variable. It is the easiest approach to finding the coordinates. All you need to know the general form of the equation of a straight line. If you are not obtaining a straight line after plotting the points, it means you are going wrong somewhere in the calculation.
Recently Updated Pages
Master Class 10 Computer Science: Engaging Questions & Answers for Success
Master Class 10 General Knowledge: Engaging Questions & Answers for Success
Master Class 10 English: Engaging Questions & Answers for Success
Master Class 10 Social Science: Engaging Questions & Answers for Success
Master Class 10 Maths: Engaging Questions & Answers for Success
Master Class 10 Science: Engaging Questions & Answers for Success
Trending doubts
What is the median of the first 10 natural numbers class 10 maths CBSE
Which women's tennis player has 24 Grand Slam singles titles?
Who is the Brand Ambassador of Incredible India?
Why is there a time difference of about 5 hours between class 10 social science CBSE
Write a letter to the principal requesting him to grant class 10 english CBSE
A moving boat is observed from the top of a 150 m high class 10 maths CBSE