


How do you graph \[y = - \dfrac{1}{2}\] using intercepts?
Answer
576.6k+ views
Hint: Linear equations in the form \[y = a\] have no \[x\]-intercept. The linear equation \[y = a\] is a line parallel to \[x\]-axis that intercept \[y\]-axis at point \[\left( {0,a} \right)\]. Therefore, the graph is a line parallel to the x-axis that cuts the y-axis at negative of half for the given equation.
Complete step-by-step solution:
The given equation \[y = - \dfrac{1}{2}\] can be written as shown below.
\[ \Rightarrow y = - \dfrac{1}{2} + 0x\] …… (1)
We are asked to draw the graph using the intercepts.
It is observed that a given equation is one of the equations of a straight line. We know this fact because both x and y terms in the equation are of power 1 (so they are not squared or square rooted terms).
We can simplify the given equation, so that our calculation becomes easier.
We find the points of intercepts and then draw a line through them as at least two points are needed to draw a unique line.
Finding the \[x\]-intercept:
The line crosses the x-axis at \[y = 0\].
Taking \[y = 0\] in the equation (1) we get,
\[ \Rightarrow 0 = - \dfrac{1}{2} + 0x\]
This can be written as,
\[ \Rightarrow 0 = - \dfrac{1}{2}\]
This is a false equation. It implies that our substitution \[y = 0\] is not true.
This further implies that the line of a given equation does not have a \[x\]-intercept, in other word line is parallel to \[x\]-axis.
Finding the \[y\]-intercept:
The line crosses the y-axis at \[x = 0\].
Taking \[x = 0\] in the equation (1) we get,
\[ \Rightarrow y = - \dfrac{1}{2} + 0\left( 0 \right)\]
This can be written as,
\[ \Rightarrow y = - \dfrac{1}{2}\]
So the point is \[\left( {0, - \dfrac{1}{2}} \right)\].
Hence the line does not have \[x\]-intercept and the \[y\]-intercept is \[\left( {0, - \dfrac{1}{2}} \right)\].
Now, we plot the graph on the x-y plane such that it cuts the y –axis at \[ - \dfrac{1}{2}\] and parallel to x-axis as shown in the below figure.
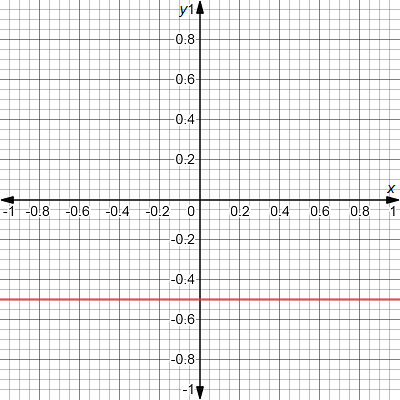
Note that the graph is a straight line parallel to x-axis.
Note: Students must remember that to obtain the \[x\]-intercept, we set the value of y equal to zero and find the point. Then, to obtain the \[y\]-intercept, we set the value of x equal to zero and find the point. Then from obtained \[(x,y)\] points we plot a graph of the given equation in the x-y plane.
Complete step-by-step solution:
The given equation \[y = - \dfrac{1}{2}\] can be written as shown below.
\[ \Rightarrow y = - \dfrac{1}{2} + 0x\] …… (1)
We are asked to draw the graph using the intercepts.
It is observed that a given equation is one of the equations of a straight line. We know this fact because both x and y terms in the equation are of power 1 (so they are not squared or square rooted terms).
We can simplify the given equation, so that our calculation becomes easier.
We find the points of intercepts and then draw a line through them as at least two points are needed to draw a unique line.
Finding the \[x\]-intercept:
The line crosses the x-axis at \[y = 0\].
Taking \[y = 0\] in the equation (1) we get,
\[ \Rightarrow 0 = - \dfrac{1}{2} + 0x\]
This can be written as,
\[ \Rightarrow 0 = - \dfrac{1}{2}\]
This is a false equation. It implies that our substitution \[y = 0\] is not true.
This further implies that the line of a given equation does not have a \[x\]-intercept, in other word line is parallel to \[x\]-axis.
Finding the \[y\]-intercept:
The line crosses the y-axis at \[x = 0\].
Taking \[x = 0\] in the equation (1) we get,
\[ \Rightarrow y = - \dfrac{1}{2} + 0\left( 0 \right)\]
This can be written as,
\[ \Rightarrow y = - \dfrac{1}{2}\]
So the point is \[\left( {0, - \dfrac{1}{2}} \right)\].
Hence the line does not have \[x\]-intercept and the \[y\]-intercept is \[\left( {0, - \dfrac{1}{2}} \right)\].
Now, we plot the graph on the x-y plane such that it cuts the y –axis at \[ - \dfrac{1}{2}\] and parallel to x-axis as shown in the below figure.
Note that the graph is a straight line parallel to x-axis.
Note: Students must remember that to obtain the \[x\]-intercept, we set the value of y equal to zero and find the point. Then, to obtain the \[y\]-intercept, we set the value of x equal to zero and find the point. Then from obtained \[(x,y)\] points we plot a graph of the given equation in the x-y plane.
Recently Updated Pages
Master Class 11 English: Engaging Questions & Answers for Success
Master Class 11 Social Science: Engaging Questions & Answers for Success
Master Class 11 Maths: Engaging Questions & Answers for Success
Master Class 11 Biology: Engaging Questions & Answers for Success
Master Class 11 Physics: Engaging Questions & Answers for Success
Master Class 11 Chemistry: Engaging Questions & Answers for Success
Trending doubts
One Metric ton is equal to kg A 10000 B 1000 C 100 class 11 physics CBSE
Difference Between Prokaryotic Cells and Eukaryotic Cells
Find the value of the expression given below sin 30circ class 11 maths CBSE
Difference between physical and chemical change class 11 chemistry CBSE
Two of the body parts which do not appear in MRI are class 11 biology CBSE
Draw a diagram of a plant cell and label at least eight class 11 biology CBSE